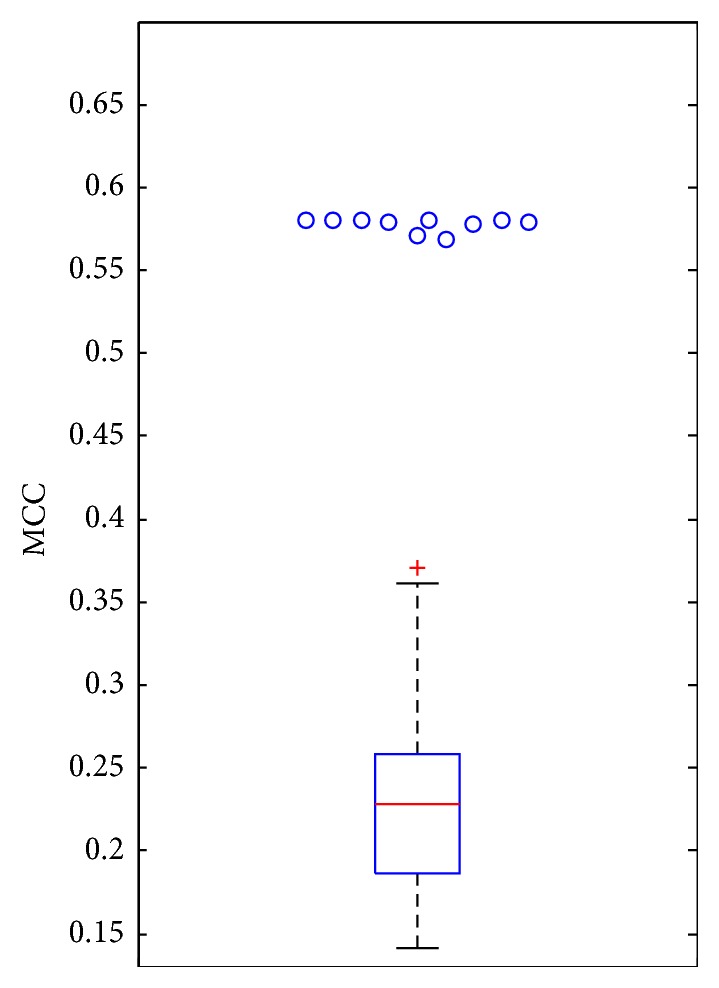
Figure 5.

The performance of the random forest (RF) on ten datasets, in which samples were represented by selected 158 features or randomly selected 158 features, evaluated by tenfold cross-validation. The box plot indicates the distribution of MCCs yielded by RF with randomly selected 158 features and the circles represent the MCCs yielded by RF with selected 158 features on ten datasets. It is clear that based on selected 158 selected features, RF produced much better performance, implying the strong associations between these features and PPIs.
