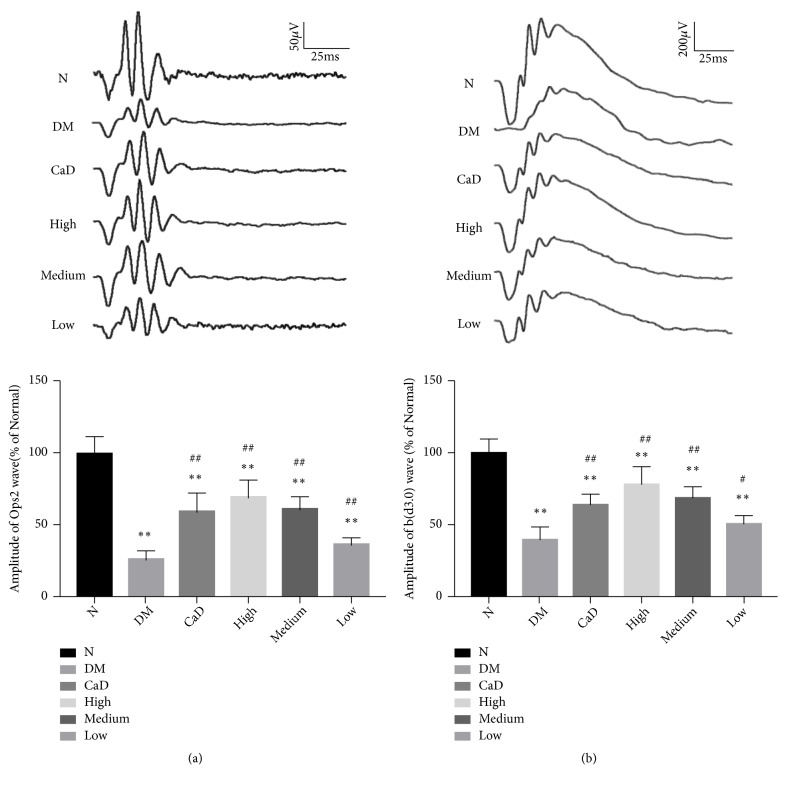
Figure 2.
FSM protects diabetic rat ERG after 42-d treatment (72 d of total duration of diabetes). (a) OPs2 wave in different groups; (b) b-wave in dark-adaptation 3.0 response in different groups. Values are presented as mean ± SD, n=8. ∗∗p < 0.01: untreated diabetic model group, CaD group, FSM high-dose, FSM medium-dose, and FSM low-dose group vs normal group; #p < 0.05, ##p < 0.01: CaD group, FSM high-dose, FSM medium-dose, and FSM low-dose group vs untreated diabetic model group.

