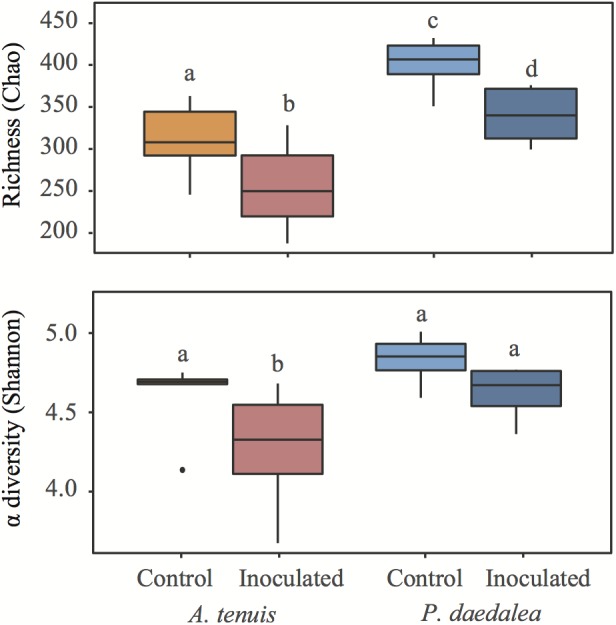
FIGURE 3.

Boxplots representing richness based on Chao and Shannon α-diversity indices in coral recruits at the end of the experiment. Different letters denote groups with significantly different richness or Shannon α-diversity index (p < 0.05). Within each graph, groups with the same letter do not have a statistically significant difference in α-diversity.
