FIGURE 4.

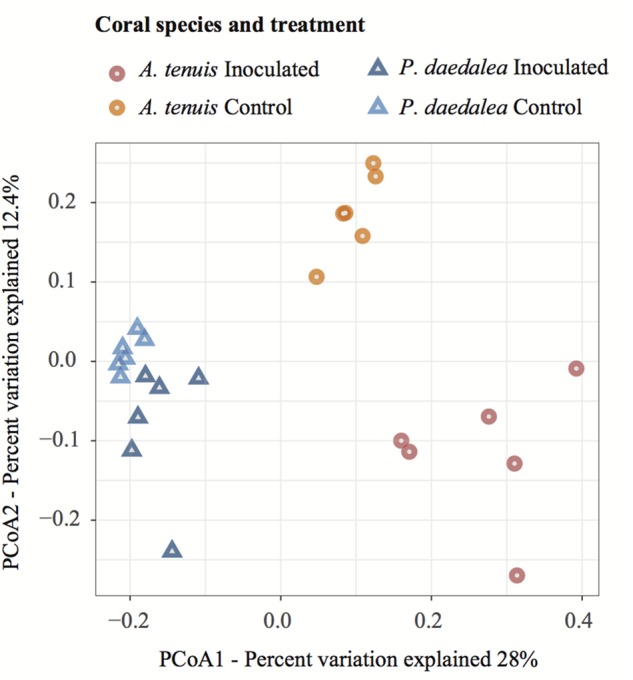
PCoA visualization using the Bray–Curtis dissimilarity measurement separating samples by treatment and host species. Samples were collected at the end of the experiment (day 42) following the seven bacterial inoculations.

PCoA visualization using the Bray–Curtis dissimilarity measurement separating samples by treatment and host species. Samples were collected at the end of the experiment (day 42) following the seven bacterial inoculations.