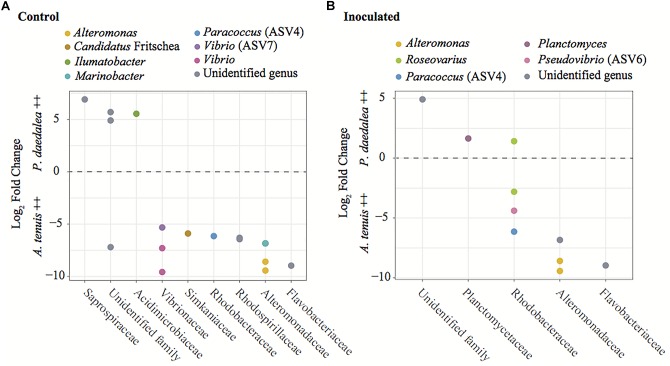
FIGURE 8.
Results from the differential abundance analysis with significance level α = 0.01, expressed as Log2 Fold Change for the comparison between A. tenuis and P. daedalea recruits within each treatment: (A) control recruits and (B) inoculated recruits. Each dot represents one ASV (including ASVs 4, 6, and 7 from the inocula), here identified at the genus level when possible. Positive values represent ASVs proportionally more abundant in P. daedalea, while negative values are ASVs proportionally more abundant in A. tenuis.

