FIGURE 3.
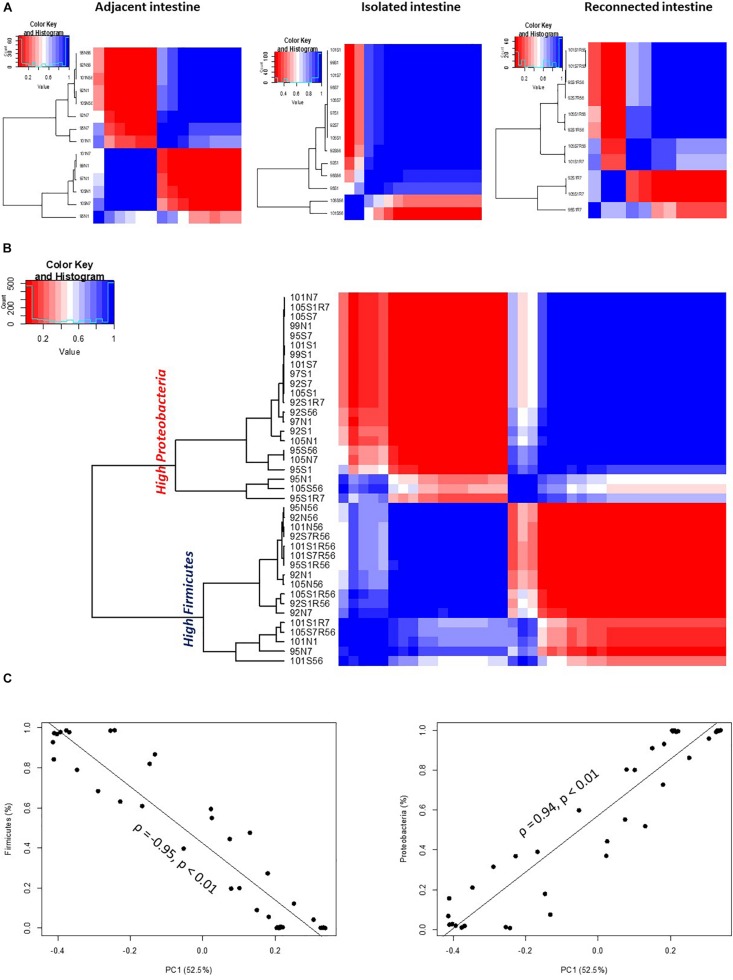
OTU-based clustering of microbial profiles generated from lamb intestinal samples. First, pairwise comparisons were made between individual microbial profiles and then hierarchical clustering using ρ2 was performed to explore similarities among the intestinal microbial profiles. Blue color represents highly correlated (ρ2 > 0.9, P < 0.05) microbial profiles. (A) Hierarchical clustering of microbial profiles within each subsection of the intestinal segments and adjacent intact intestine. The majority of microbial profiles generated from the intestinal (except 2) subsections that remained isolated from adjacent intestine belong to one main cluster (ρ2 > 0.9, P < 0.05), while profiles generated from adjacent intact small intestine and subsections of the intestinal segments reconnected to adjacent small intestine displayed varying clustering patterns. (B) Hierarchical clustering of microbial profiles generated from all intestinal samples resulted in two distinct clusters. Cluster 1 included all samples with a high relative abundance of Proteobacteria and Cluster 2 included all samples with a high relative abundance of Firmicutes. (C) Correlation between principle coordinate 1 (PC1) and the relative abundance of Firmicutes and Proteobacteria.

