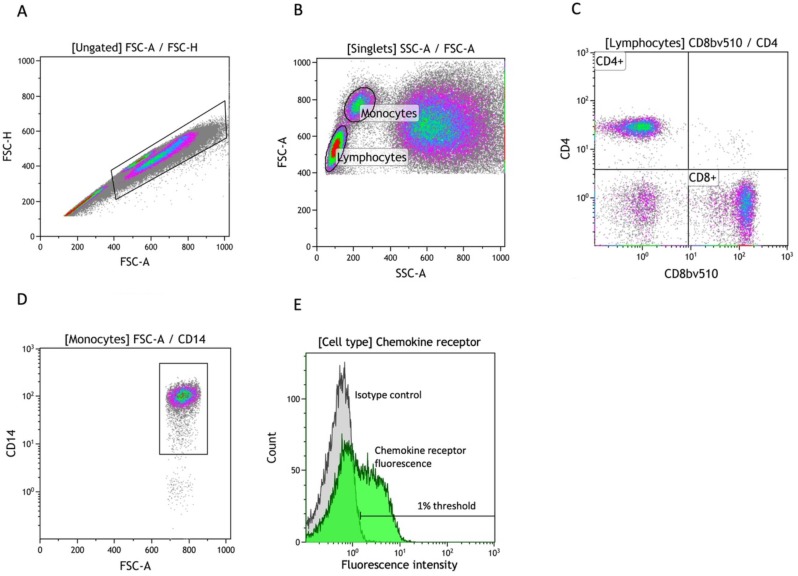
Figure 1.
Gating strategy in flow cytometry analysis. (A) Identification of singlets using FSC-A versus FSC-H. (B) Subtyping of singlets into monocytes and lymphocytes using FSC-A versus SSC-A. (C) Isolation of CD4+/CD8+ lymphocytes using fluorochrome-coupled specific antibodies. (D) Isolation of CD14+ monocytes using fluorochrome-coupled specific antibodies. (E) A general example of quantification of chemokine receptor (eg, CCR1) positive cells using a fluorescence histogram and a negative isotype control with a threshold of 1%. FSC-A, front scatter area; FSC-H, front scatter height; SSC-A, side scatter area.

