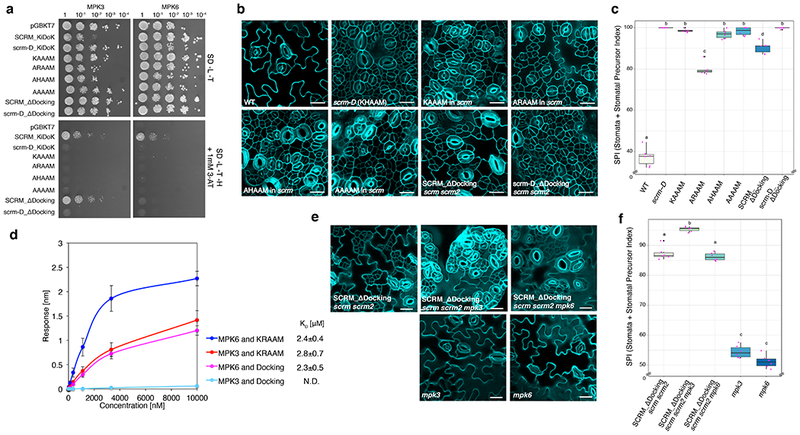
Fig. 3: MPK3 and MPK6 exhibit different binding modes to the SCRM KiDoK motif to repress stomatal cell fate.

a, Y2H assays of SCRM-KiDoK motif substitutions/deletions with MPK3/6. Bait: the DNA-binding domain alone (DB), the wild-type KiDoK motif (SCRM_KiDoK), scrm-D version of the KiDoK motif (scrm-D_KiDoK), ‘KAAAM’, ‘ARAAM’, ‘AHAAM’, and ‘ARAAM’ versions of the SCRM KiDoK motif, and Kinase-Docking deletion in SCRM (SCRM_ΔDocking) and scrm-D (scrm-D_ΔDocking). Prey: the activation domain fused to MPK3 and MPK6. SCRM_ΔDocking motif only abolished interaction with MPK6, but not with MPK3. The experiment was repeated independently three times with similar results. b, Cotyledon abaxial epidermis of 7 day-old wild-type (WT) and transgenics Arabidopsis seedlings expressing the SCRM-KiDoK motif substitutions/deletions (scrm-D, SCRMpro::SCRM-’KAAAM’, SCRMpro::SCRM-’ARAAM’, SCRMpro::SCRM-’AHAAM’, and SCRMpro::SCRM-’AAAAM’ in the scrm background, and SCRMpro::FLAG-SCRM_ΔDocking and SCRMpro::FLAG-scrm-D_ΔDocking in the scrm scrm2 background. Scale bars = 20 μm. Each representative confocal image was obtained after imaging atleast 2 independent frames from 6 seedlings for each genotype. c, Quantitative analysis. Stomata + Stomatal Precursor Index (SPI) of the cotyledon abaxial epidermis from 7-day-old seedlings of WT, scrm-D, KAAAM, ARAAM, AHAAM, AAAAM, SCRM_ΔDocking and scrm-D_ΔDocking genotypes. For each genotype, one image from six seedlings were analyzed (n = 6). One-way ANOVA followed by Tukey’s HSD test was performed for comparing all other genotypes and classify their phenotypes into four categories (a, b, c and d). Results from the Tukey’s HSD test are listed in Table S5. In the boxplot, the horizontal bar indicates the median value. The upper and lower hinges of each box indicate the top and the bottom quartile of the reported values, respectively. The whiskers correspond to 1.5 times the interquartile range. Black points indicate outliers. Pink points indicate values of individual data points.
d, Quantitative analysis of interactions between the KRAAM motif and the Kinase Docking motif of SCRM with GST-MPK3 and GST-MPK6 using BLI. Shown is the in-vitro binding response curve for purified GST-MPK3/6 and biotinylated KRAAM motif peptide and Docking motif peptide at 6 different concentrations (10000, 3333.33, 1111.11, 370.4, 123.4, 41.1 nM). Values represent the mean and error bars the S.D. of three independent experiments performed. KD values are listed next to the graph legend. e, Representative stomatal phenotypes of SCRMpro::3x-FLAG-SCRM_ΔDocking in scrm scrm2, scrm scrm2 mpk3 and scrm scrm2 mpk6 along with mpk3 and mpk6 single mutants. Abaxial epidermis from 7-day-old plants were imaged. Scale bars = 20 μm. Each representative confocal image was obtained after imaging atleast 2 independent frames from 6 seedlings for each genotyp.
f, Quantitative analysis. Stomata + Stomata Precursor index (SPI) of the cotyledon abaxial epidermis from 7-day-old seedlings of SCRM_ΔDocking in scrm scrm2 mpk3, SCRM_ΔDocking in scrm scrm2 mpk6, mpk3 and mpk6 genotypes. For each genotype, one image from six seedlings were analyzed (n=6). One-way ANOVA followed by Tukey’s HSD test was performed for comparing all other genotypes and classify their phenotypes into three categories (a, b, and c). Results from the Tukey’s HSD test are listed in Table S5. In the box plot, the horizontal bar indicates the median value. The upper and lower hinges of each box indicate the top and the bottom quartile of the reported values, respectively. The whiskers correspond to 1.5 times the interquartile range. Black points indicate outliers. Pink points indicate values of individual data points.
