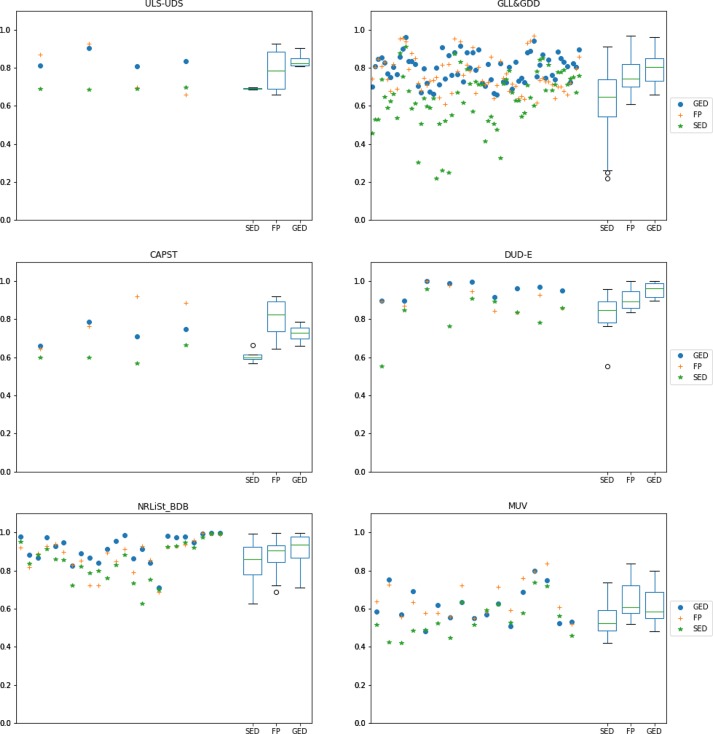
Figure 8.
AUC results for all available targets in the LBVS benchmarking platform separated by data set. Each scattered value on the left of each subplot represents the median value of 10 predefined random-built splits. A different color and shape is used for each similarity method. Box-and-whisker plots on the right of each subplot show the distribution of the resulting values for each similarity method.

