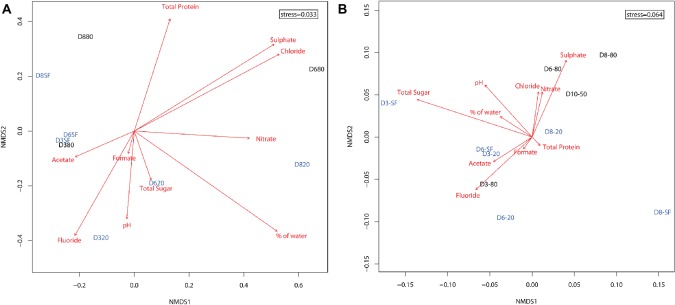
Figure 4.
Two dimensional non-metric multidimensional scaling (NMDS) ordination plot of sampling points (based on Bray-Curtis similarities) for the distribution of (A) microbial OTUs (stress = 0.033) and (B) presence of proteins (stress = 0.064) in the samples. Shallow and intermediate depth samples (from surface – SF – and 20 cm depth, respectively) are shown in light blue. Deeper samples (from 50 and 80 cm depth) are shown in black. Red arrows represent the fitness of physicochemical factors into the ordination, with higher magnitude arrows corresponding to higher correlations to the data (arrow lengths cannot be compared across plots). Nitrite and bromide data were excluded from analyses due to their very scarce detection in the samples.

