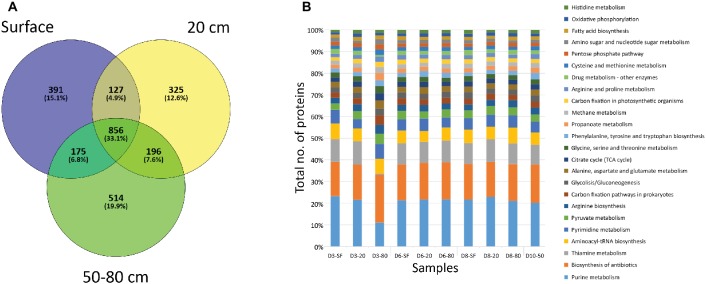
Figure 5.
Distribution of proteins by depth of sampling. (A) Venn diagram showing the number of unique (i.e. only found at one depth) and shared proteins among soil samples grouped by depth. “SF” group comprises D3-SF, D6-SF, and D8-SF samples; “20 cm” group comprises D3-20, D6-20, and D8-20 samples; “50–80 cm” group comprises D3-80, D6-80, D8-80, and D10-50 samples. (B) Bar plot showing the distribution among sampling points of proteins related to different cellular processes, according to KEGG database project (see legend). Note that detected processes that account for less than 1% of the total number of proteins were not plotted.

