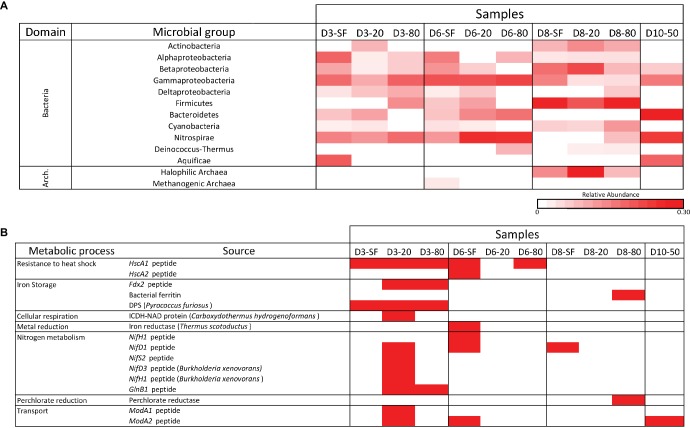
Figure 6.
LDChip results distribution heatmaps. (A) Bacterial and archaeal groups among sampling points and depths (SF-surface, 20, 50, and 80 cm) by means of LDChip200 analyses. The antibodies recognized by LDChip200 (further information in Sánchez-García et al., 2018) were reorganized on the basis of the phylogeny of the targets. Average signal intensity corresponding to positive antibody reactions within each category was used as a proxy for relative abundance, calculated according to He et al. (2007). White color indicates non-detected signal, while intensity of positive signals is indicated from light pink (lower signal) to red (higher signal). (B) Positive immunosignals related to microbial metabolism among sampling points and depths (SF-surface, 20, 50, and 80 cm) by means of LDChip200 analyses (further information in Sánchez-García et al., 2018). Red color indicates positive antibody reaction (positive fluorescence signal), while white color indicates lack of positive reactions (i.e. presence-absence of positive immunoreaction).

