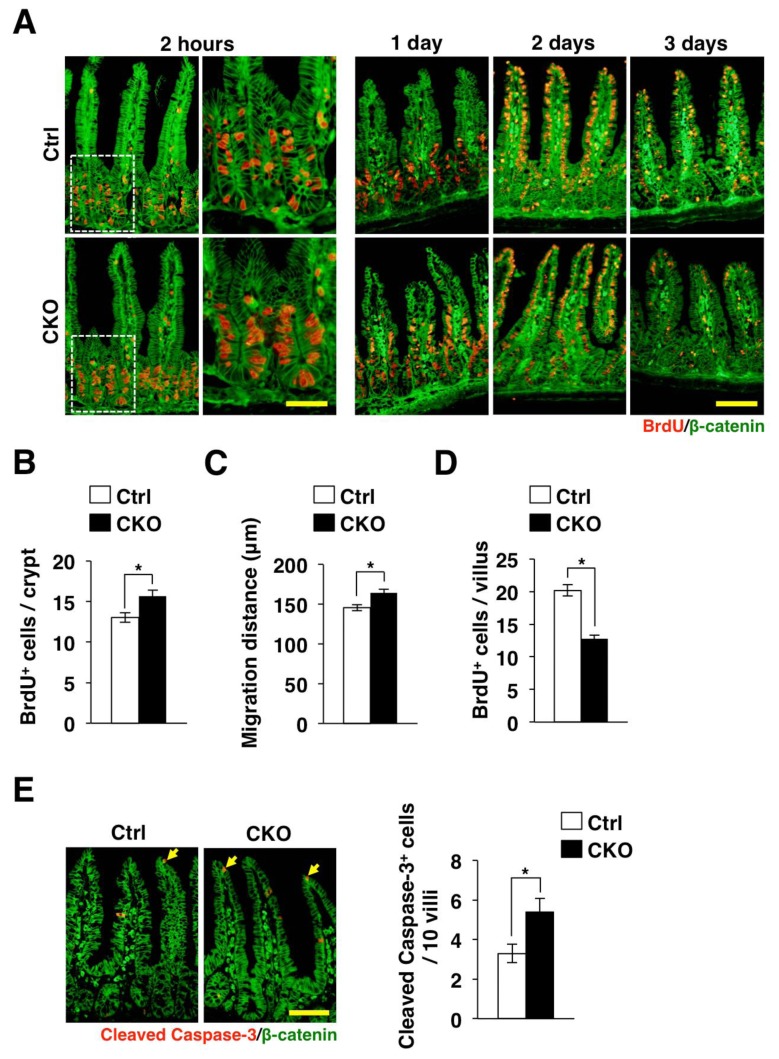
Figure 3.
Promotion of the turnover of IECs in Tsc2 CKO mice. (A) Frozen sections of the small intestine from control or Tsc2 CKO mice were prepared at 2 h or 1, 2, or 3 days after BrdU injection and were immunostained with antibodies to BrdU (red) and to β-catenin (green). The boxed areas in the left panels for the sections prepared at 2 h after BrdU injection are shown at higher magnification in the right panels. Scale bars, 50 μm (higher magnification) or 100 μm (lower magnification). (B) The number of BrdU-positive cells per crypt at 2 h after BrdU injection was determined from sections similar to those in (A). Data are means ± SE for 90 crypts of three mice. *, P < 0.05. (C) The migration distance for BrdU-positive cells at 1 day after BrdU injection was determined from sections similar to those in (A). Data are means ± SE for 90 villi from three mice. *, P < 0.05. (D) The number of BrdU-positive cells per villus at 3 days after BrdU injection was determined from sections similar to those in (A). Data are means ± SE for 90 villi of three mice. *, P < 0.05. (E) Frozen sections of the small intestine from control or Tsc2 CKO mice were immunostained with antibodies to cleaved caspase-3 (red) and to β-catenin (green). Representative images are shown in the left panels. Scale bar, 100 μm. The number of cleaved caspase-3-positive cells per 10 villi in such sections was also determined. Data are means ± SE for 100 villi of three mice. *, P < 0.05.

