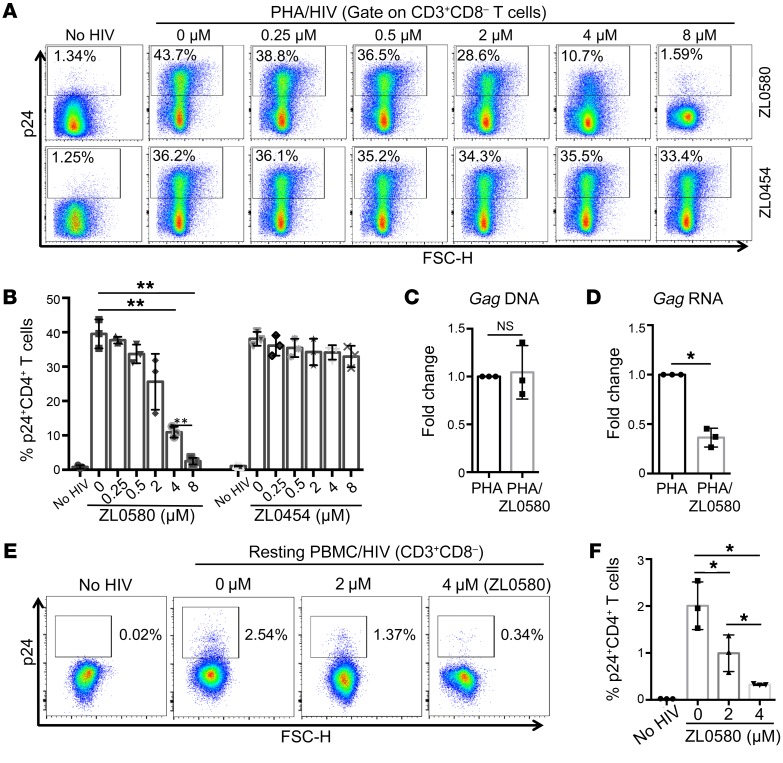
Figure 2. HIV suppression by ZL0580 in in vitro HIV-infected human CD4+ T cells.
(A) HIV infection of PHA-activated CD4+ T cells in normal PBMCs. PBMCs (n = 3) were stimulated with PHA (1 μg/mL) for 2 days, followed by infection with R5 HIV (US-1) in the absence or presence of ZL0580 (top) or ZL0454 (bottom) at various concentrations, as indicated. Three days after viral exposure, HIV infection in CD4+ T cells was measured by flow cytometry based on intracellular p24 staining. Representative FACS plots are shown. (B) Comparison of percentage of p24+CD4+ T cells in PBMCs. (C and D) Quantification of HIV DNA (C) and Gag RNA (D) in PBMCs following different treatments by qPCR. Data are shown as fold change of PHA/ZL0580 (4 μM) relative to PHA alone. (E) Representative FACS plots showing HIV infection (intracellular p24) of unactivated CD4+ T cells in PBMCs on day 6 after treatment. (F) Comparison of p24+ percentage in unactivated CD4+ T cells in PBMCs. (B–D and F) Mean ± SD from 3 PBMC donors. *P < 0.05; **P < 0.01, 1-way ANOVA (B and F) and paired Student’s t test (C and D).

