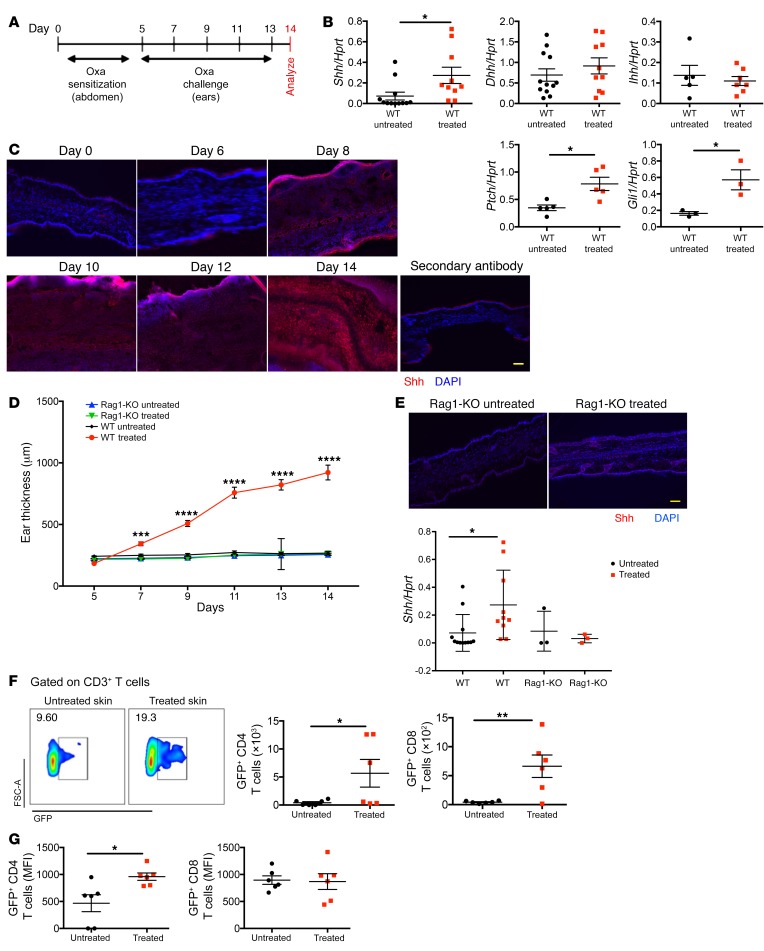
Figure 1. Shh upregulation and in vivo activation of the Hh signaling pathway upon induction of AD.
Black circles, control mice; red squares, Oxa-treated mice. Each symbol represents an individual animal. (A) Sensitization and challenge scheme of Oxa treatment. (B) mRNA expression by QRT-PCR of Hh signaling components in whole ear skin homogenates from untreated WT and Oxa-treated WT mice. Data from 2 independent experiments. (C) Representative immunofluorescence staining images of Shh (red) expression in frozen skin sections from untreated WT (day 0) and Oxa-treated WT mice on days 6, 8, 10, 12, and 14 after initiation of the Oxa protocol. DAPI-stained nuclei are shown in blue. Scale bar: 100 μm (n = 5 mice per group). (D) Time course of ear thickness from Rag1-KO control (blue), Oxa-treated Rag1-KO (green), WT control (black), and Oxa-treated WT (red) mice (n = 6 per group). (E) Representative immunofluorescence staining images of Shh (red) expression in frozen skin sections from untreated Rag1-KO and Oxa-treated Rag1-KO mice on termination (day 14). DAPI-stained nuclei are in blue. Scale bar: 100 μm (n = 3 mice per group). Plot shows comparison of Shh mRNA expression in whole ear homogenates from control untreated Rag1-KO (n = 3) and Oxa-treated Rag1-KO (n = 3) with equivalent Shh expression data from WT from B. Data from 2 independent experiments. (F) Representative density plots of GFP expression in skin CD3+ T cells from untreated and Oxa-treated GBS-GFP transgenic mice, giving percentage of cells in GFP+ region shown. Plots show number of skin GFP+CD4+ and GFP+CD8+ T cells isolated from ears from untreated and Oxa-treated GBS-GFP transgenic mice. (G) MFI of GFP in skin GFP+CD4+ and GFP+CD8+ T cells from untreated and Oxa-treated GBS-GFP transgenic mice. In B, E–G, 2-tailed unpaired Student’s t test was used; in D, ANOVA was used. Plots show mean ± SEM. *P < 0.05, **P < 0.01, ***P < 0.001, ****P < 0.0001.

