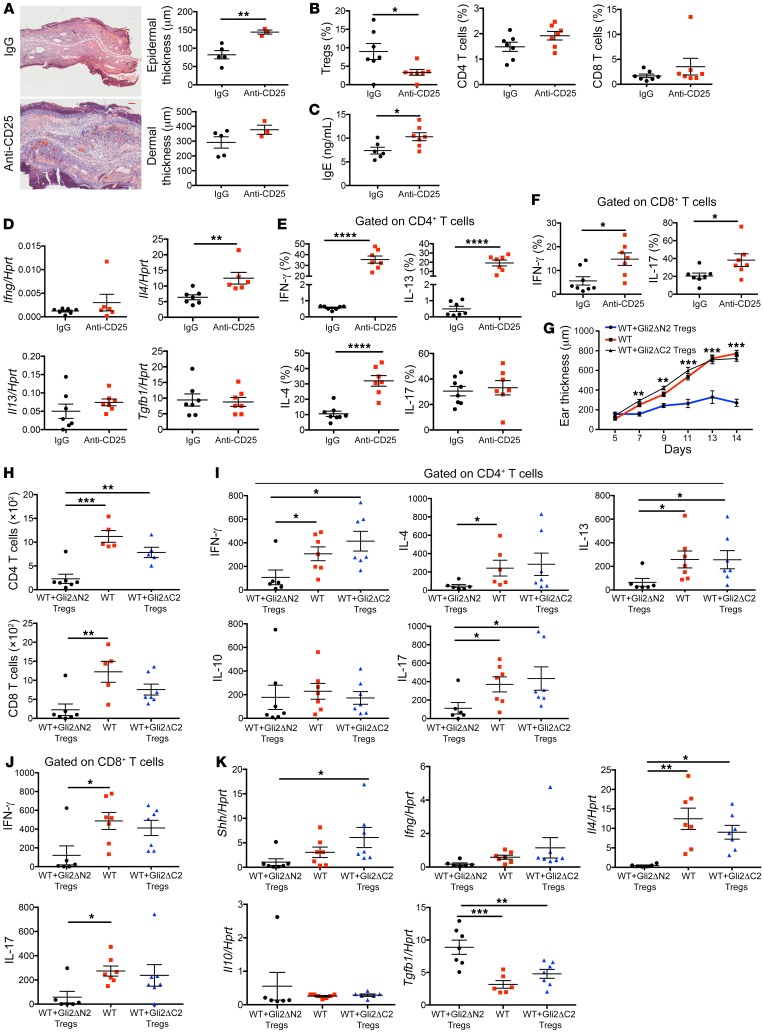
Figure 7. Hh signaling promotes skin Treg populations and their immune-regulatory function.
(A–F) Groups of Gli2ΔN2 mice (7 per group unless stated otherwise) were injected in vivo with anti-CD25 antibody (red) or control IgG (black) 4 days before initiation of the Oxa protocol and again on day 7 (Supplemental Figure 5D). (A) Representative H&E images of skin sections from Oxa-treated anti-CD25–injected (n = 3) and control (IgG-injected, n = 5) Gli2ΔN2 groups on day 14. Scale bar: 100 μm. Plots show dermal and epidermal thickness. (B) Percentage of Tregs (CD25+icFoxp3+) (gated on CD4+) from ears of control and anti-CD25–treated groups (left). Percentage of CD4+T cells and CD8+T cells (gated on live cells) from ears (center and right). (C) Serum IgE concentration (ELISA) from control and anti-CD25–treated groups. (D) Ifng, Il4, Il13, and Tgfb1 expression (QRT-PCR) in ear homogenates. (E) Percentage of skin CD4+ T cells that express cytokines. (F) Percentage of skin CD8+ T cells that express cytokines. (G–K) Adoptive transfer into Oxa-treated WT mice. Purified CD4+CD25+ (Tregs) from spleens of Oxa-treated Gli2ΔN2 (Gli2ΔN2 adoptive transfer group, n = 7, black) or Gli2ΔC2 mice (Gli2ΔC2 adoptive transfer group, n = 7, blue) were injected into WT mice 2 days before and on day 7 of Oxa protocol (Supplemental Figure 5E), and compared with Oxa protocol WT control mice (control group; n = 7, red). (G) Ear thickness on days 5 to 14 of the Oxa protocol of WT control, Gli2ΔN2 adoptive transfer, and Gli2ΔC2 adoptive transfer groups (**P < 0.01 and ***P < 0.001, 2-tailed t test between WT control and Gli2ΔN2 adoptive transfer group). (H) Number of CD4+ T cells and CD8+ T cells recovered from ears from the 3 experimental groups. (I) Number of CD4+ T cells that expressed cytokines. (J) Number of CD8+ T cells that expressed cytokines. (K) Ifng, Il4, Il10, Tgfb1, and Shh expression (QRT-PCR) in ear homogenates. Two-tailed unpaired Student’s t test. (I–K) One-way ANOVA; each symbol represents an individual animal, showing mean ± SEM. *P < 0.05, **P < 0.01, ***P < 0.001, ****P < 0.0001.

