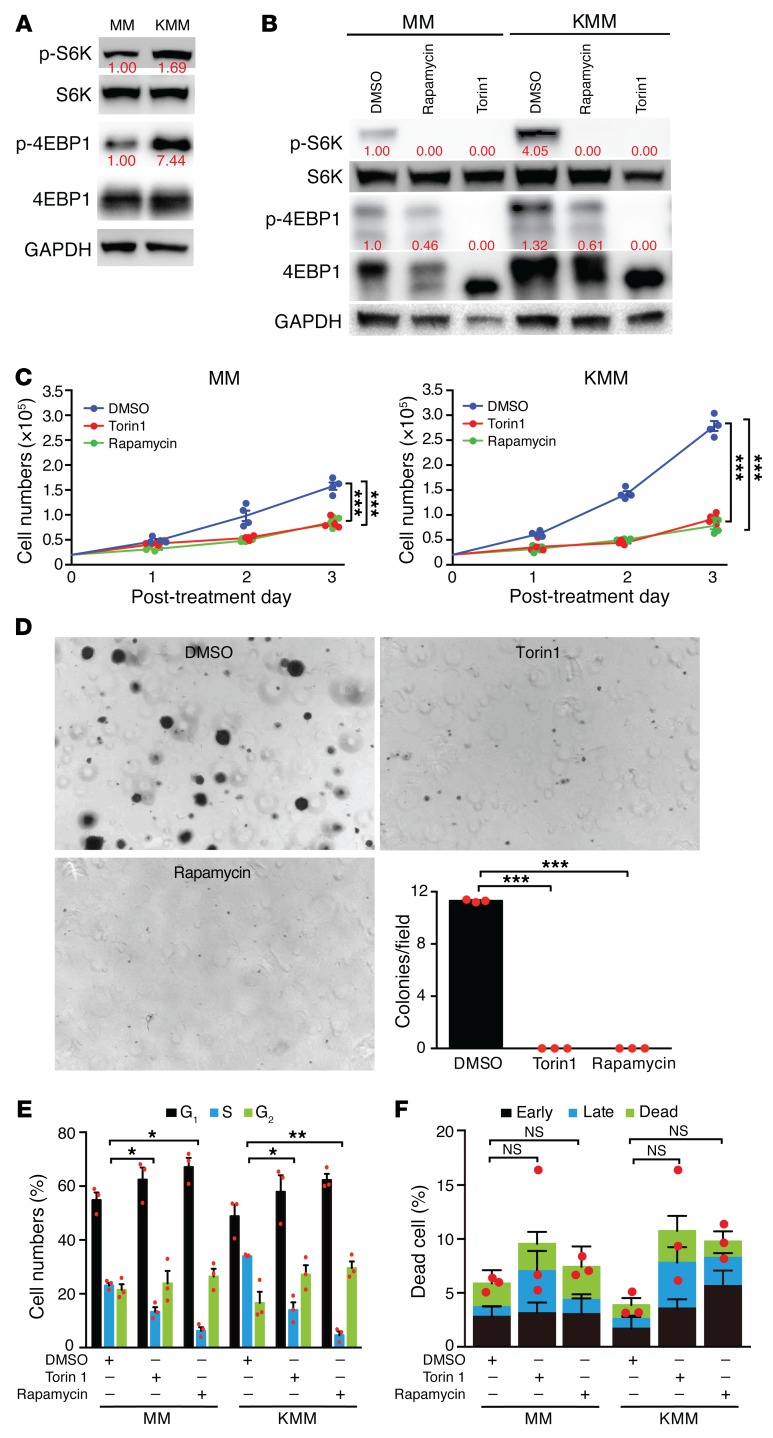
Figure 1. KSHV-transformed cells activate the mTORC1 pathway and are sensitive to mTOR inhibitors.
(A) mTORC1 was activated in KSHV-transformed cells. Cells were analyzed for p-4EBP1 at Ser65 and p-S6K at Thr389. Three independent experiments were repeated with similar results, and results of 1 representative experiment are shown. (B) Rapamycin and Torin1 inhibited mTORC1 activation in KSHV-transformed cells. Cells were treated with DMSO, 100 nm rapamycin, or 50 nm Torin1 for 16 hours and analyzed for mTORC1 activation. Three independent experiments were repeated with similar results, and results from 1 representative experiment are shown. The same set of samples were run in different gels but with the same loading calibration. (C) Rapamycin and Torin1 significantly inhibited proliferation of KSHV-transformed cells. Cells were treated with DMSO, 100 nM rapamycin, or 50 nM Torin1, and cell numbers were counted daily. Three independent experiments were repeated with similar results, and results from 1 representative experiment with 4 biological replicates are shown as the mean ± SEM. (D) Rapamycin and Torin1 significantly inhibited colony formation of KMM cells in soft agar. KMM cells treated with DMSO, 200 nM rapamycin, or 100 nM Torin1 were examined for colony formation in soft agar. Representative images acquired with a ×4 objective are shown. Graph shows the quantification of colonies with a diameter of greater than 50 μm. Three independent experiments were repeated, and results are shown as the mean ± SEM. (E and F) Rapamycin and Torin1 induced cell-cycle arrest but no significant apoptosis in MM and KMM cells. Cells were treated with DMSO, 100 nM rapamycin, or 50 nM Torin1 for 24 hours and analyzed for (E) cell-cycle progression or (F) apoptosis. Three independent experiments were repeated, and results are shown as the mean ± SEM. Data were analyzed by 1-way ANOVA followed by Tukey’s post hoc test for P values below 0.05. *P < 0.05, **P < 0.01, and ***P < 0.001.

