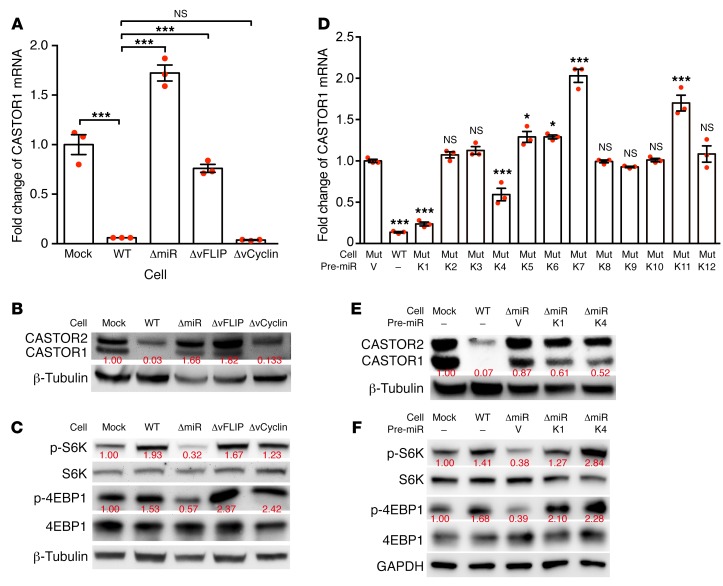
Figure 3. Pre–miR-K1 and -K4 mediate KSHV downregulation of CASTOR1 and activation of mTORC1.
(A and B) The miRNA cluster and vFLIP mediated KSHV downregulation of CASTOR1. Analysis of CASTOR1 mRNA levels by RT-qPCR (A) and protein levels by Western blotting (B) in mock (MM), WT (KMM), ΔmiR, ΔvFLIP, and ΔvCyclin, cells. Three independent experiments were repeated with similar results, and results from 1 representative experiment are shown. mRNA results from 3 biological replicates are shown as the mean ± SEM. (C) The miRNA cluster mediated KSHV activation of the mTORC1 pathway. Analysis of the mTORC1 downstream effectors p-S6K and p-4EBP1 in mock, WT, ΔmiR, ΔvFLIP, and ΔvCyclin cells by Western blotting. Three independent experiments were repeated with similar results, and results from 1 representative experiment are shown. The same set of samples were run in different gels but with the same loading calibration. (D and E) Pre–miR-K1 and -K4 mediated KSHV downregulation of CASTOR1. Analysis of CASTOR1 mRNA (D) and protein (E) levels in WT cells and ΔmiR cells complemented with vector control or individual KSHV pre-miRNAs. mRNA results in D were from 3 biological replicates and are shown as the mean ± SEM. Three independent experiments were repeated with similar results, and results from 1 representative experiment are shown. Mut, mutant. (F) Pre–miR-K1 and -K4 mediate mTORC1 activation. Western blot analysis of the mTORC1 downstream effectors p-S6K and p-4EBP1 in mock and WT cells and ΔmiR cells complemented with vector control (V) or pre–miR-K1 or -K4. Three independent experiments were repeated with similar results, and results from 1 representative experiment are shown. Data were analyzed by 1-way ANOVA followed by Tukey’s post hoc test for P values below 0.05. *P < 0.05 and ***P < 0.001.

