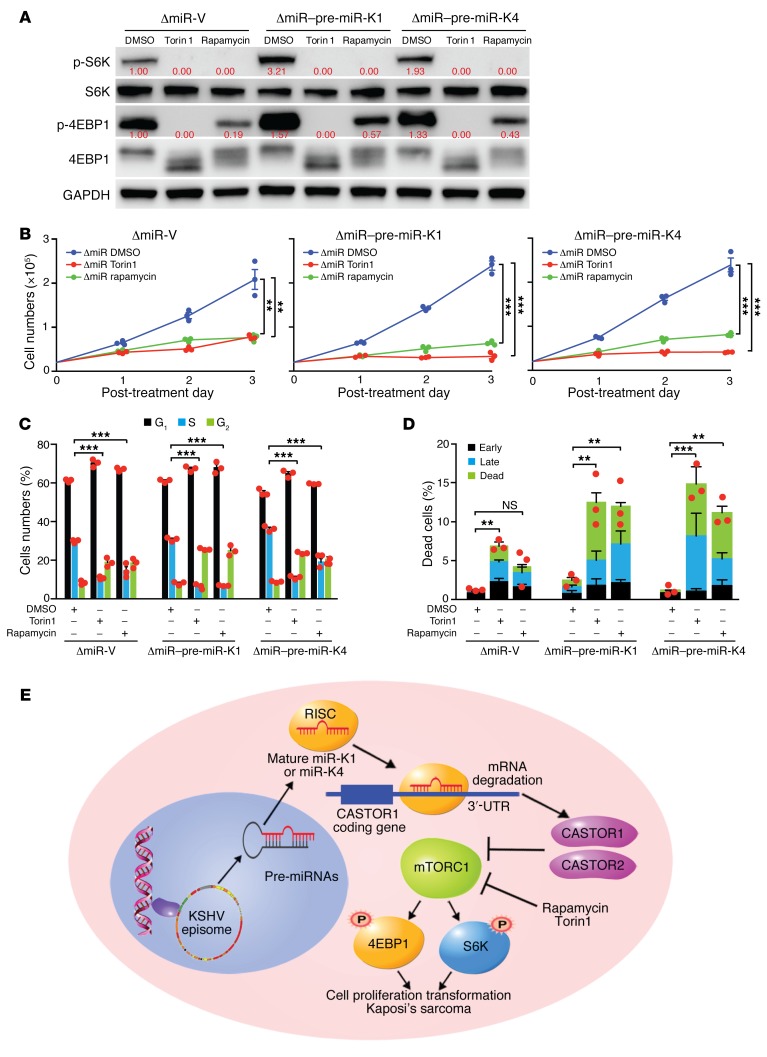
Figure 8. mTOR inhibitors suppress pre–miR-K1 and -K4–induced cell proliferation.
(A) The mTOR inhibitors rapamycin and Torin1 inhibited mTORC1 activation in ΔmiR-V, ΔmiR–pre–miR-K1, and ΔmiR–pre–miR-K4 cells. Cells were treated with DMSO, 200 nM rapamycin, or 50 nM Torin1 for 4 hours and analyzed for mTORC1 activation by examining expression of the downstream effectors p-S6K and p-4EBP1 by Western blotting. Results from 1 experiment are shown. (B) Rapamycin and Torin1 significantly inhibited pre–miR-K4 and -K4–induced cell proliferation. ΔmiR-mutant cells stably expressing vector control (ΔmiR-V), pre–miR-K4 (ΔmiR–pre–miR-K4), or pre–miR-K1 (ΔmiR–pre–miR-K1) were treated with DMSO, 100 nM rapamycin, or 50 nM Torin1, and cell numbers were counted daily. Three independent experiments were repeated with similar results, and results from 1 representative experiment with 3 biological replicates are shown as the mean ± SEM. (C and D) Rapamycin and Torin1 inhibit pre–miR-K4 and -K4-induced cell-cycle progression and induce apoptosis. ΔmiR-mutant cells stably expressing vector control (ΔmiR-V), pre–miR-K4 (ΔmiR-pre-K4) or pre–miR-K1 (ΔmiR-pre-K1) were treated with DMSO, 100 nM rapamycin or 50 nM Torin1 for 24 hours, and analyzed for cell-cycle progression (C) and apoptosis (D). Three independent experiments were repeated with similar results, and results from 1 representative experiment with 3 biological replicates are shown as the mean ± SEM. (E) Schematic illustration of KSHV miR-K4-5p and possibly miR-K1-5p direct suppression of CASTOR1, leading to activation of the mTORC1 pathway, enhanced cell proliferation, and cellular transformation. Data in B–D were analyzed by 1-way ANOVA followed by Tukey’s post hoc test for P values below 0.05. **P < 0.01 and ***P < 0.001.

