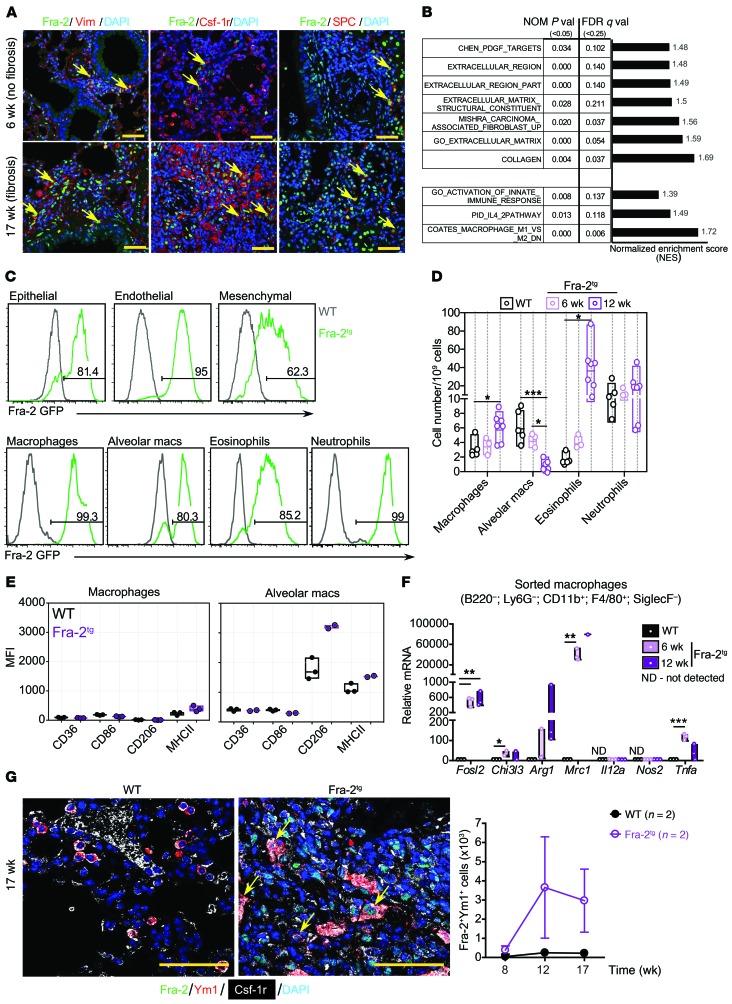
Figure 1. Alternative activation of macrophages in Fra-2Tg fibrotic lungs.
(A) Confocal microscopy images of IF for Fra-2 (green) and Vimentin (Vim), Csf-1r, or SPC (red). Arrows point to double-positive cells. Nuclei are counterstained with DAPI (blue). Scale bars: 25 μm. (B) GSEA on ECM- and type 2 immunity-related pathways in Fra-2Tg lungs compared with WT littermates (6 weeks, RNA-Seq, n = 3/3 from 1 experiment). Normalized enrichment score (NES), nominal (NOM) P values, FDR, and Q values are indicated. (C) Flow cytometry analysis on GFP expression in epithelial (CD45–EpCAM+), endothelial (CD45–EpCAM–CD31+), and mesenchymal (CD45–EpCAM–CD31–CD140a+) cells and in myeloid cell subpopulations in WT (black) and Fra-2Tg (green) mouse lungs at 12 weeks of age. Percentages of GFP-positive cells in the plots are shown. (D) Relative myeloid subpopulation cell numbers. Experiment was repeated twice. Mean, maximum, and minimum are plotted with individual values. *P < 0.05; ***P < 0.001, 1-way ANOVA; Bonferroni’s post test. Group comparisons in each cell type are shown. macs, macrophages. (E) Expression of surface markers on nonalveolar (Siglec-F–CD11bhiF4/80+; left) and alveolar (Siglec-F+CD11blo; right) macrophages in the lungs of 12-week-old WT (black) and Fra-2Tg (purple) mice. Median fluorescence intensity (MFI) is plotted. (F) qRT-PCR analysis of lung macrophages isolated by FACS (n = 3; biological replicates from 1 experiment). Relative expression in WT is set to 1. *P < 0.05; **P < 0.01; ***P < 0.001, unpaired 2-tailed t test. (G) Left, confocal microscopy images of Fra-2 (green), Csf-1r (white), and Ym1 (red) costaining. Nuclei are counterstained with DAPI (blue). Arrows point to triple-positive cells. Scale bars: 50 μm. Right, computational quantification of double Fra-2– and Ym1-positive cell numbers (n = 2; biological replicates from 1 experiment).

