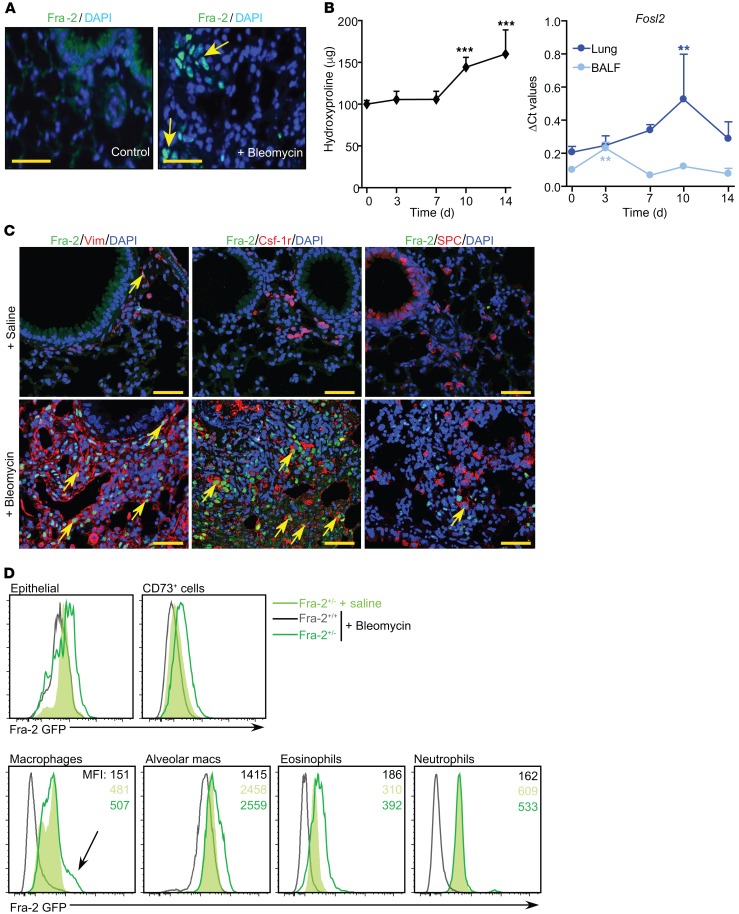
Figure 2. Fra-2 expression in bleomycin-induced lung fibrosis.
(A) Fluorescence microscopy images of Fra-2 IF of lungs from WT mice 10 days after saline or bleomycin treatment. Nuclei are counterstained with DAPI. Arrows point to positive nuclei. Scale bars: 25 μm. (B) Time-course analysis of hydroxyproline accumulation and Fra-2 mRNA expression (qRT-PCR as Fosl2) in lungs and BALF from bleomycin-treated WT mice. ΔCt values are plotted. Sample size is n = 5 for lung tissue and n = 3 for BALF. **P < 0.01; ***P < 0.001, compared with the initial time point (0 days); 1-way ANOVA; Dunnet’s post test. (C) Confocal microscopy images on IF of fibrotic lungs from untreated and bleomycin-treated WT mice (14 days). Costaining for Fra-2 (green) and vimentin, Csf-1r, or SPC (red). Arrows point to double-positive cells. Nuclei are counterstained with DAPI (blue). Scale bars: 25 μm. (D) Flow cytometry analysis of lung GFP-expressing cells after 10 days of either saline or bleomycin (n = 3/group, from 2 independent experiments). MFI average values are presented in each plot. Arrow indicates a subpopulation of Fra-2–expressing macrophages present in bleomycin-treated mice that were absent from saline-treated controls.

