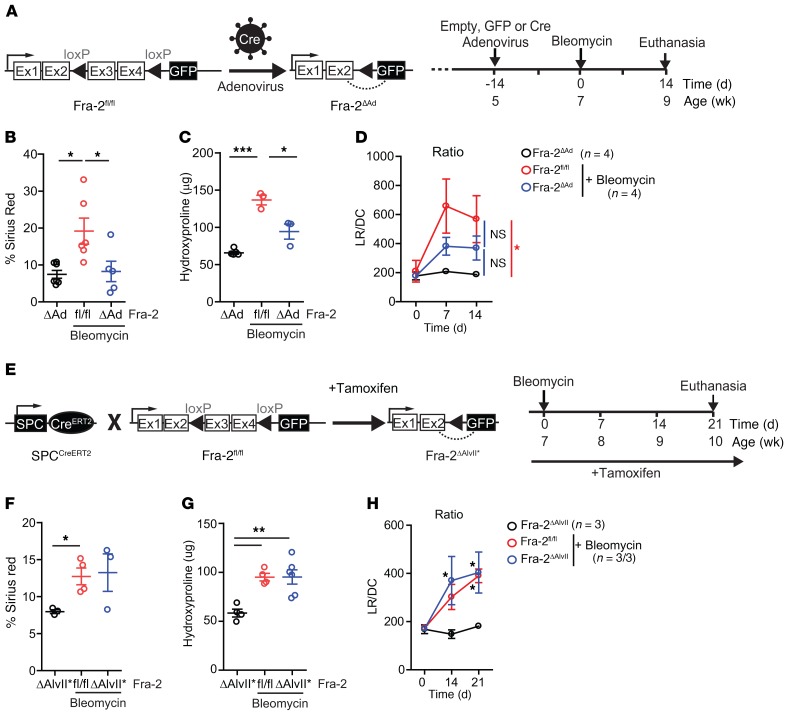
Figure 3. Fra-2 expression is essential for bleomycin-induced lung fibrosis.
(A) Schematic for genetic Cre/LoxP inactivation of Fra-2 (encoded by fosl2) using intratracheal adenovirus-based Cre delivery (Fra-2ΔAd) and experimental time line. Data come from 2 independent experiments. (B) Quantification of sirius red–positive areas 14 days after bleomycin treatment. Saline-treated Fra-2ΔAd mice were used as controls. *P < 0.05, 1-way ANOVA; Bonferroni’s post test. (C) Hydroxyproline content in lungs (left lobe) 14 days after bleomycin treatment. Saline-treated Fra-2ΔAd mice were used as controls. *P < 0.05; ***P < 0.001, 1-way ANOVA; Bonferroni’s post test. (D) LR (mmHg/mL × s–1) and DC (mL/mmHg) were measured by plethysmography in the same animals over time, and mean ± SEM of the LR/DC ratios were plotted. *P < 0.05, 2-way ANOVA; Bonferroni’s post test. Statistics relative to animals receiving saline. (E) Schematic for genetic Cre/LoxP inactivation of Fra-2 (encoded by Fosl2) using the tamoxifen-inducible, lung alveolar type II cell–specific SPCCreERT2 knockin allele (Fra-2ΔAlvII*) and experimental time line. Experiment was repeated 3 times. (F) Quantification of lung sirius red–positive areas 21 days after bleomycin. *P < 0.05, unpaired 2-tailed t test. Fibrosis was assessed in 2 independent experiments. (G) Lung hydroxyproline content 21 days after bleomycin treatment. **P < 0.01, 1-way ANOVA; Bonferroni’s post test. Fibrosis was assessed in 2 independent experiments. (H) Respiratory function of bleomycin-treated Fra-2fl/fl and Fra-2ΔAlvII* mice and saline-treated Fra-2ΔAlvII* mice. *P < 0.05, 2-way ANOVA; Bonferroni’s post test. Statistics are relative to mice receiving saline.

