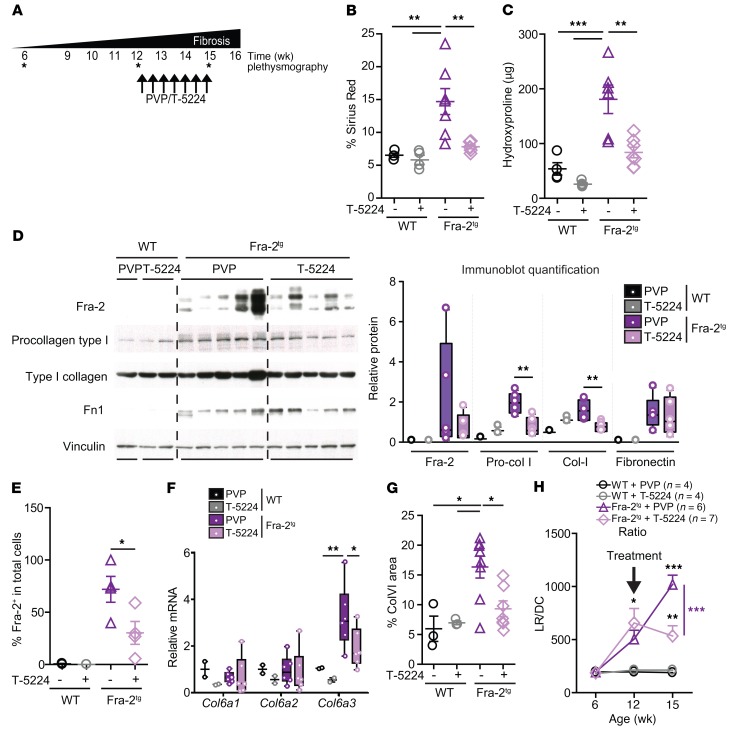
Figure 7. AP-1 inhibition reverts lung fibrosis in Fra-2Tg mice.
(A) Schematic for AP-1 inhibitor T-5224 therapeutic protocol in Fra-2Tg mice. All data originate from 3 independent experiments designed as randomized blocks. Asterisks indicate when the plethysmography was performed within the experiment timeline. (B) Quantification of sirius red–positive areas in lungs at the end of the experiment. **P < 0.01, 1-way ANOVA; Bonferroni’s post test. (C) Hydroxyproline content in lungs (left lobe). **P < 0.01; ***P < 0.001, 1-way ANOVA; Bonferroni’s post test. (D) Immunoblot analysis of Fra-2, procollagen I, type I collagen, and fibronectin in lung lysates at the end of the experiment. Band density quantification is shown in the graph, with individual values relative to vinculin (loading control). **P < 0.01, unpaired 2-tailed t test. (E) Quantification of Fra-2–positive nuclei in lung IF relative to total cells. *P < 0.05, unpaired 2-tailed t test. (F) qRT-PCR analysis of ColVI genes in the lungs of Fra-2Tg and WT controls treated with T-5224 or PVP at the end of the experiment. Relative expression in WT+PVP is set to 1. *P < 0.05; **P < 0.01, 1-way ANOVA; Bonferroni’s post test. (G) Quantification of lung ColVI-positive area in IHC staining. *P < 0.05, 1-way ANOVA; Bonferroni’s post test. (H) Longitudinal analyses of respiratory function of Fra-2Tg and WT controls with T-5224 or PVP. Note that the T-5224 or vehicle treatment started around 12 weeks of age, when animal respiratory function was already compromised (arrow). *P < 0.05; **P < 0.01; ***P < 0.001, 2-way ANOVA; Bonferroni’s post test.

