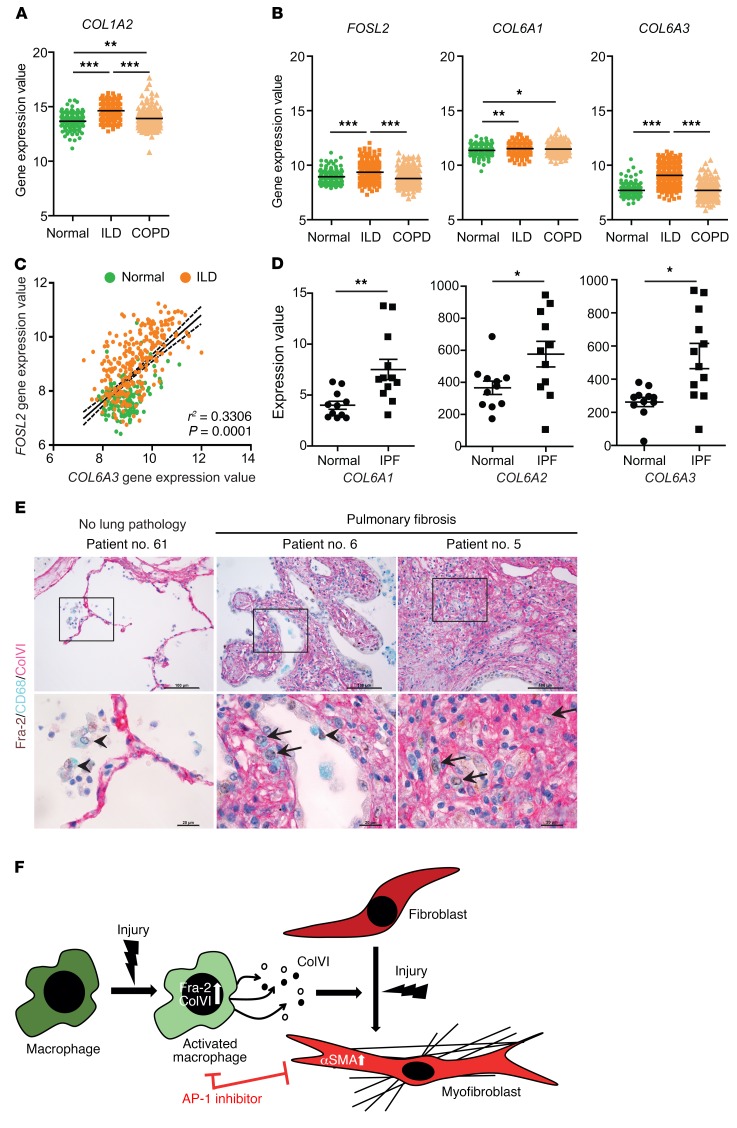
Figure 8. Fra-2 and ColVI expression in human lung fibrosis.
(A) Gene expression values of COL1A2 in lungs from human patients with normal histology (normal; n = 173) and diagnosed ILD (n = 255) and COPD (n = 219). Expression values were obtained from the public gene expression database of the LGRC (GSE47460). **P < 0.01; ***P < 0.001, 1-way ANOVA; Bonferroni’s post test. (B) Gene expression values of FOSL2 (Fra-2), COL6A1 (ColVI chain α1), and COL6A3 (ColVI chain α3) genes in lungs from same cohort. Note that expression values for COL6A2 (ColVI chain α2) were absent in the data set. *P < 0.05; **P < 0.01; ***P < 0.001, 1-way ANOVA; Bonferroni’s post test. (C) Expression values for FOSL2 are plotted against COL6A3 for linear regression and Pearson’s correlation analysis of normal and ILD samples (r2 and P values are indicated). (D) Gene expression values of ColVI genes in lungs from human patients with normal histology (normal) and diagnosed IPF. Expression values were obtained from a public curated data set (GDS1252). *P < 0.05; **P < 0.01, 2-tailed paired t test. (E) Triple IHC for Fra-2 (brown-nuclear), CD68 (blue-cytoplasmic), and ColVI (purple-extracellular) of human lungs from healthy and fibrosis patients. Nuclei are counterstained with hematoxylin. Arrows point to interstitial macrophages expressing Fra-2 and colocalizing with ColVI (triple positive); arrowheads point to Fra-2–positive alveolar macrophages. Scale bars: 100 μm (low magnification); 20 μm (high magnification). (F) Working model for the role of Fra-2/ColVI in macrophages during lung fibrosis.

