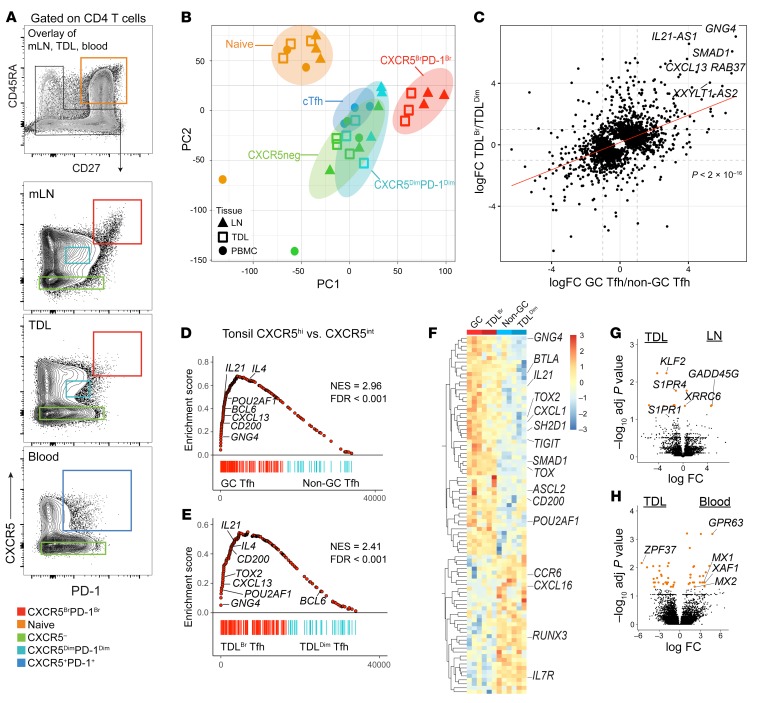
Figure 5. TDL CXCR5BrPD-1Br Tfh are transcriptionally similar to GC Tfh.
(A) Gating strategy for sort purification with an overlay of flow cytometry plots for blood (n = 3), TDL (n = 3), and mesenteric LNs (n = 3): naive (orange gate) and nonnaive (black gate). Nonnaive cells were sorted based on the gates shown for each tissue source: CXCR5BrPD-1Br (red), CXCR5DimPD-1Dim (teal), CXCR5– non-Tfh (green) and cTfh (blue). Plots for TDL and blood are shown in Figure 1A. mLN, mesenteric lymph node. (B) Principal component analysis of RNA-Seq data; colors represent populations from the matching gate color in A. (C) Correlation plot of the fold change from CXCR5BrPD-1Br Tfh to CXCR5DimPD-1Dim Tfh in TDL (TDLBr and TDLDim, respectively) and LNs (GC Tfh and non-GC Tfh, respectively). (D) GSEA of transcriptional signatures from tonsil GC Tfh versus tonsil non-GC Tfh (GSE50391) compared with differentially expressed genes in GC versus non-GC Tfh from LNs and (E) TDLBr Tfh versus TDLDim Tfh. Normalized enrichment scores (NES) and FDR marked on each GSEA. (F) Heatmap of leading edge genes from the LNs and TDL GSEAs in D and E were compared for overlap in both positively and negatively enriching genes. (G) Volcano plot of differentially expressed transcripts (adjusted P < 0.05 in orange) for LN Tfh (dim and bright) versus all TDL Tfh (dim and bright). (H) Volcano plot for differentially expressed transcripts (adjusted P < 0.05 in orange) for all TDL Tfh (dim and bright) versus blood cTfh.

