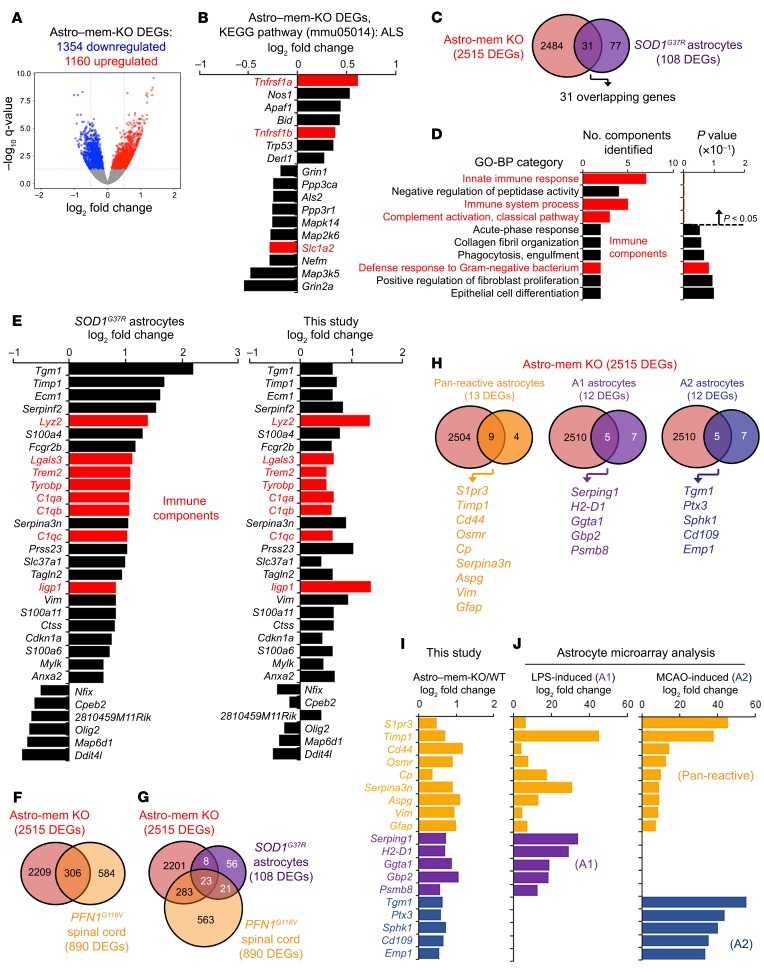
Figure 5. Changes in global transcription with astrocyte membralin deletion overlap with ALS astrocyte and reactive astrocyte signatures.
(A) Volcano plot depicting differentially regulated genes (DEGs) identified in Astro–mem-KO and WT mouse motor cortex. (B) Expression of 17 DEGs in the ALS (mmu05014) KEGG pathway category from the 2515 DEGs shown in A using DAVID Functional Analysis. (C–D) Comparison of Astro–mem-KO motor cortex and SOD1G37R spinal cord astrocyte DEGs at disease onset. (C) There were 31 overlapping DEGs identified in Astro–mem-KO motor cortex (red) and SOD1G37R astrocytes (purple). (D) Functional GO-BP analysis of the 31 overlapping genes identified in C. Red bars indicate pathways related to immune function. (E) Comparison of differential regulation profiles of Astro–mem-KO spinal cord/SOD1G37R ALS astrocyte DEGs. The graph on the left shows log2 fold changes in mouse SOD1G37R astrocytes, the graph on the right shows DEGs identified in Astro–mem-KO motor cortex by RNAseq analysis. Red bars represent immune components in the immune-related BP categories shown in D. (F) Comparison of Astro–mem-KO and PFNG118V spinal cord DEGs. There were 306 overlapping DEGs observed in Astro–mem-KO (red) and PFNG118V (dark yellow) spinal cord. (G) There were 23 overlapping DEGs found in Astro–mem-KO (red) and SOD1G37R astrocytes (purple) and PFNG118V spinal cord (dark yellow). (H–I) Overlaps of Astro–mem-KO DEGs with DEGs characterized from A1 neuroinflammatory and A2 ischemia-induced astrocytes. (H) Venn diagrams depicting overlaps of DEGs from Astro–mem-KO spinal cord and pan-reactive (dark yellow), A1 (purple), and A2 (blue) astrocytes. (I) Log2 fold change of overlapping DEGs shown in H as characterized by RNAseq analysis. (J) Fold change in expression of overlapping DEGs from H as characterized previously by microarray in astrocytes treated with LPS or derived from MCAO ischemic models.

