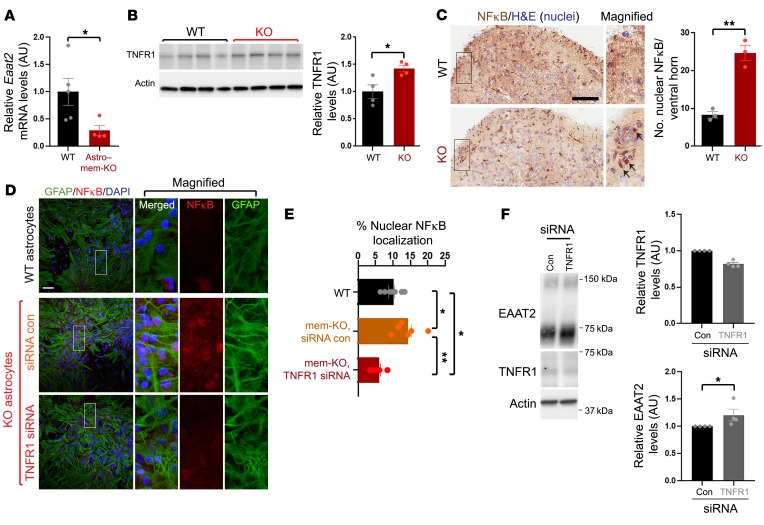
Figure 6. TNFR1/NFκB signaling mediates EAAT2 reductions resulting from membralin deletion.
(A) qRT-PCR analysis of Eaat2 mRNA from motor cortex in WT and Astro–mem-KO animals, normalized to 18s rRNA. (B) TNFR1 levels were assessed by immunoblot in spinal cord from WT and mem-KO animals. Quantification depicts normalized TNFR1 levels (WT mean set to 1.0). (C) Nuclear NFκB localization was examined in P3 WT and mem-KO spinal cord. Number of NFκB-positive nuclei was determined in n = 3 animals/genotype. Scale bar: 100 μm. Arrows indicate nuclear NFκB. (D) WT or mem-KO astrocytes were transfected with 50 nM control or TNFR1 siRNA and stained for GFAP (green), NFκB (red), or DAPI. Scale bar: 50 μm. (E) Quantification of NFκB-positive nuclei shown in D (normalized to DAPI; scale bar: 50 μm). (F) Mem-KO astrocytes transfected with control or TNFR1 siRNA were immunoblotted for EAAT2, TNR1, or actin as indicated. Adjacent graphs depict TNFR1 (left graph) or EAAT2 (right graph) levels. All quantification graphs represent mean ± SE; statistical significance was determined by unpaired Student’s t test (significance in F was subjected to paired t test analysis), with the exception of E, which was subjected to 1-way ANOVA/Tukey’s multiple comparison. *P < 0.05, **P < 0.01.

