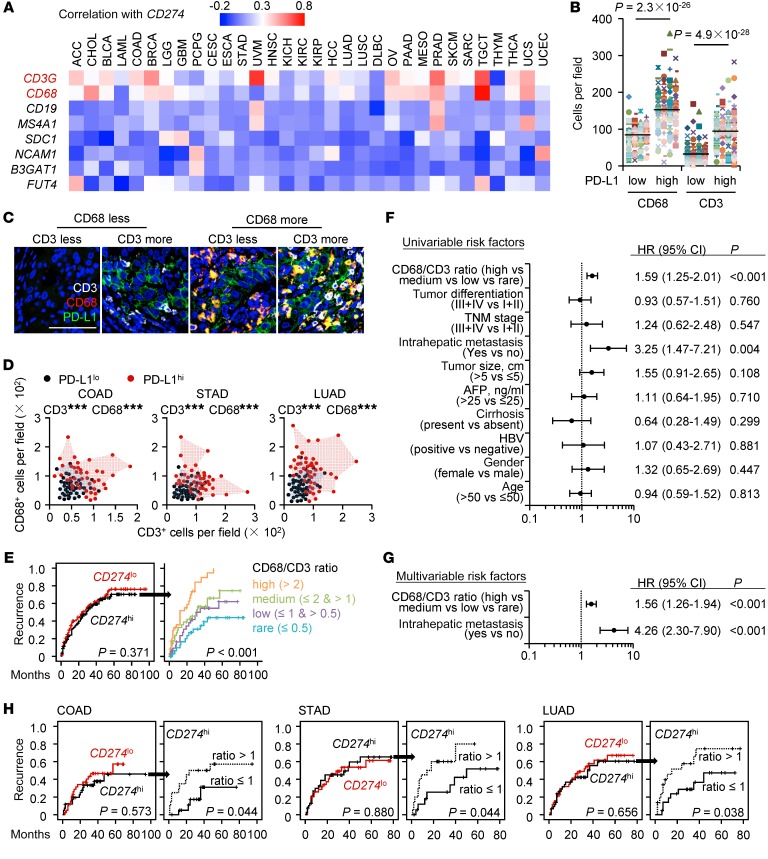
Figure 2. Immune landscapes of PD-L1hi cancers affect patients’ clinical outcomes.
(A) Correlations between CD274 and indicated genes were calculated in 9138 patients with 32 types of cancer samples from TCGA data set. (B) Correlations of macrophage and T cell densities with PD-L1 expression in HCC tissues (n = 276). Student’s t test. (C) Confocal microscopy analysis of PD-L1+ cells (green), CD68+ macrophages (red), and CD3+ T cells (white) in HCC tissue. Results represent 3 independent experiments (n = 8). Scale bar: 100 μm. (D) Densities of macrophages and T cells in PD-L1lo or PD-L1hi COAD (n = 82), STAD (n = 78), and LUAD (n = 89) tissues. (E) 276 Patients with HCC were divided into 2 groups according to the median value of CD274 expression in tumors: red lines, low expression (n = 138); black lines, high expression (n = 138). 138 CD274hi patients were further divided into 4 groups according to the ratio of macrophages to T cells in tumors: orange line, ratio value > 2, n = 39; green line, ratio value ≤ 2 and > 1, n = 30; purple line, ratio value ≤ 1 and > 0.5, n = 31; blue line, ratio value ≤ 0.5, n = 38. (F and G) Univariate (F) and multivariate (G) regression analyses of factors associated with recurrence. Cox proportional hazards regression model. (H) 82, 78, and 89 Patients with COAD, STAD, and LUAD, respectively, were analyzed for the prognosis value of CD274 expression plus macrophage/T cell ratio. Patients were divided into 2 groups according to the value of CD274 expression in tumors or ratio of macrophages to T cells in CD274hi tumors. Recurrence times were calculated by the Kaplan-Meier method and analyzed by the log-rank test. ***P < 0.001.

