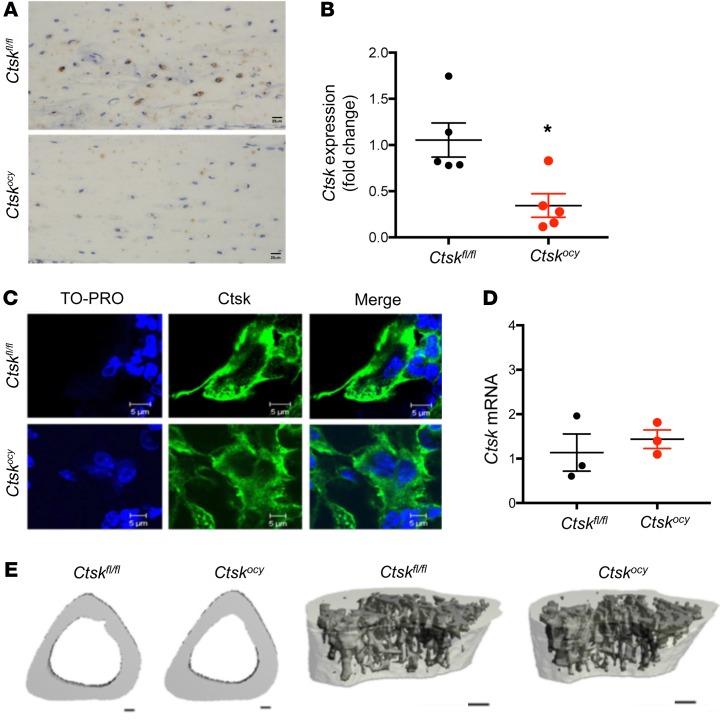
Figure 1. Normal skeletal homeostasis in mice with osteocyte-specific deletion of Ctsk at steady state.
(A) Representative images of Ctsk immunostaining in osteocytes from Ctskfl/fl and Ctskocy mice (n = 3 per group). Scale bars: 20 μm. (B) qRT-PCR analysis of Ctsk expression in BM-depleted distal femur from 12-week-old Ctskfl/fl (black dots) and Ctskocy (red dots) mice. (n = 5 per group). *P < 0.05, by Student’s t test versus Ctskfl/fl mice. Data are expressed as the mean ± SEM. (C) Representative images of Ctsk immunostaining in osteoclasts from Ctskfl/fl and Ctskocy mice (n = 3). Scale bars: 5 μm. (D) qRT-PCR analysis of relative Ctsk expression in osteoclasts. Ctskfl/fl (black dots) and Ctskocy (red dots) mice (n = 3 per group). Data are expressed as the mean ± SEM. (E) Representative μCT images of the cortical area and the trabecular microarchitecture of tibiae from 12-week-old female Ctskfl/fl and Ctskocy mice (n = 6 per group). Scale bars: 100 μm.

