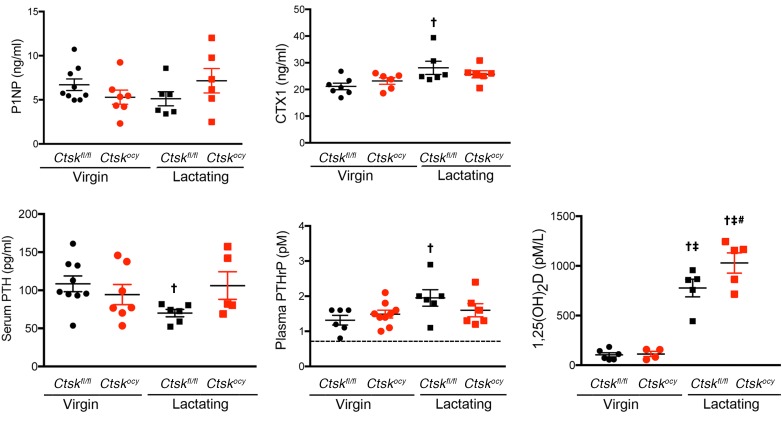
Figure 5. Deletion of Ctsk in osteocytes affects serum hormone and CTX1 levels.
P1NP, CTX1 PTH, PTHrP, and 1,25(OH)2 vitamin D3 levels in serum or plasma from virgin and lactating Ctskfl/fl (black dots and squares, respectively) and Ctskocy (red dots and squares, respectively) mice. For PTHrP, the dotted line represents the limit of detection of the assay. Data are expressed as the mean ± SEM (n = 5–9 per group). †P < 0.05 compared with virgin Ctskfl/fl mice; ‡P < 0.05 versus virgin Ctskocy mice; #P < 0.05 versus lactating Ctskfl/fl mice; 2-way ANOVA followed by Fisher’s PLSD test.

