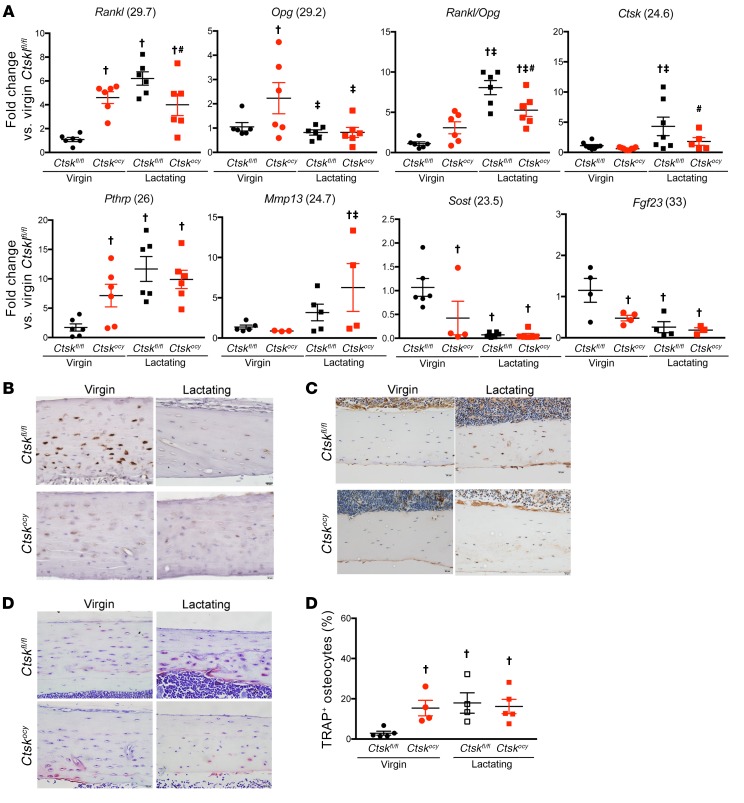
Figure 6. Deletion of Ctsk in osteocytes affects the expression of genes involved in bone remodeling.
(A) qRT-PCR analysis of mRNA expression in BM-depleted tibiae and femurs from virgin and lactating Ctskfl/fl (black dots and squares, respectively) and Ctskocy (red dots and squares, respectively) mice (n = 5–9 per group). Numbers in parentheses are the Ct values for the highest level of expression of each gene. (B–D). Representative images of sclerostin (B), Ctsk immunostaining (C), and TRAP staining (D) in osteocytes from virgin and lactating Ctskfl/fl and Ctskocy mice (n = 4–7 per group). Scale bars: 20 μm. (E) Quantification of TRAP staining (n = 4 to 5 per group). Data are expressed as the mean ± SEM. †P < 0.05 versus virgin Ctskfl/fl mice; ‡P < 0.05 versus virgin Ctskocy mice; and #P < 0.05 versus lactating Ctskfl/fl mice; 2-way ANOVA followed by Fisher’s PLSD test.

