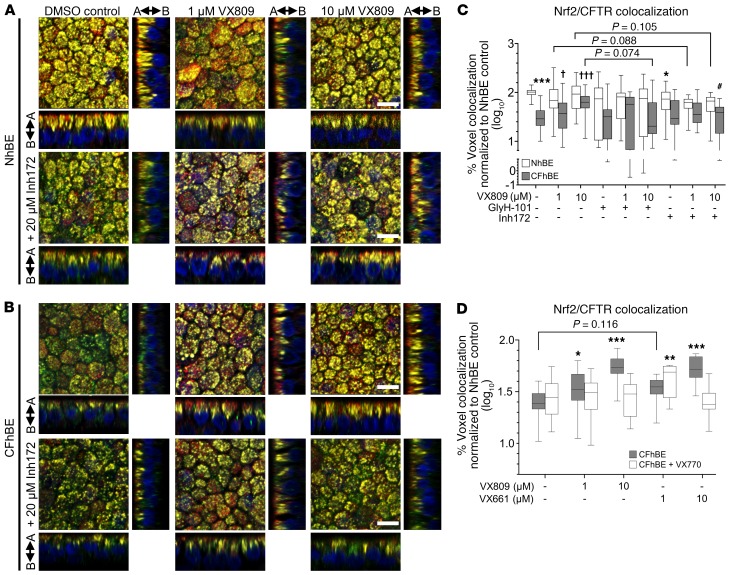
Figure 4. VX809 increases colocalization of CFTR and Nrf2 in CFhBE cells, which is blocked by coincubation with inhibitors of CFTR.
(A and B) Representative photographs, at ×60 original magnification, of IF for Nrf2 (green), CFTR (red), and nuclei (DAPI, blue) in primary NhBE (A) and CFhBE (B) cells treated with indicated doses of VX809 and/or CFTRinh-172 (Inh172) for 72 hours. Colocalization of CFTR and Nrf2 is in yellow, and arrows indicate apical (A) and basolateral (B) sides. Cells permeabilized as in Figure 2. (C and D) Quantification of Nrf2-CFTR colocalization in NhBE and CFhBE cells after incubation with 1–10 μM VX809 and/or 20 μM CFTRinh-172 or GlyH-101 for 72 hours (11 independent experiments with 6 CF and 5 non-CF donors, with 3 technical replicates per treatment) (C), or 1–10 μM VX809 or VX661 and/or 1 μM VX770 for 48 hours (4 independent experiments with 4 CF and 3 non-CF donors, with 3 replicates per treatment per donor) (D). Data are expressed as box-and-whisker plots. Horizontal bars indicate the median, box borders indicate 25th and 75th percentiles, and whiskers indicate 5th and 95th percentiles. For C, *P < 0.05, ***P < 0.001 vs. NhBE vehicle control; †P < 0.05, †††P < 0.001 CFhBE treatments vs. CFhBE vehicle control; #P < 0.05 vs. same donor cells with same dose of VX809 by mixed-effects ANOVA and Dunnett’s multiple-comparisons test. For D, *P < 0.05, **P < 0.01, ***P < 0.001 vs. CFhBE vehicle control by mixed-effects ANOVA and Dunnett’s multiple-comparisons test. Scale bars: 10 μm.

