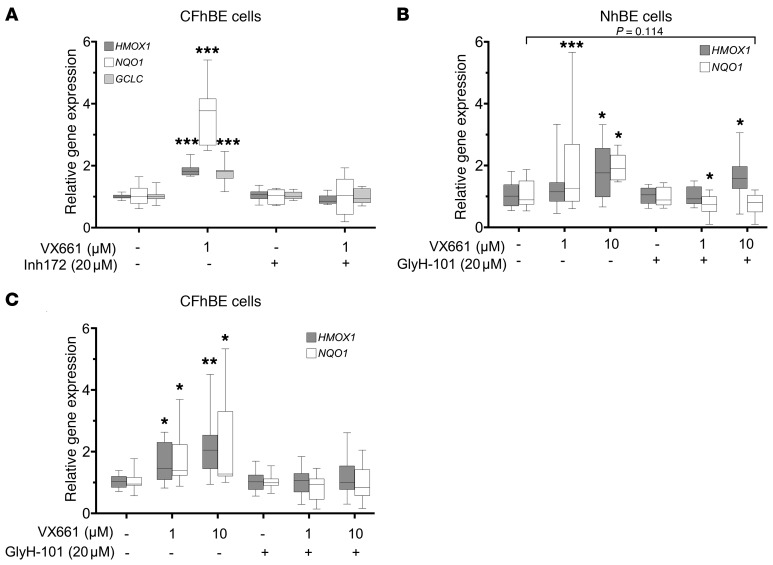
Figure 7. Inhibition of CFTR function blocks CFTR modulator–induced expression of Nrf2 target genes.
(A) Primary CFhBE cells were incubated with vehicle (DMSO) control or 1 μM VX661 and/or CFTRinh-172 (Inh172) for 48 hours. (B and C) Primary NhBE (B) or CFhBE (C) cells were treated with DMSO control or the indicated doses of VX661 and/or GlyH-101 for 72 hours. Gene expression of Nrf2-activated genes (HMOX1 and NQO1) was determined by real-time qPCR. Gene expression is expressed as fold changes versus control cells (DMSO control, Inh172, or GlyH-101 alone), and was calculated from cycle threshold and normalization to the control gene, 18S rRNA. Data for 3–6 independent experiments from 3 CF and 3 non-CF donors with 3–4 replicates per treatment per donor are expressed as box-and-whisker plots. Horizontal bars indicate the median, box borders indicate 25th and 75th percentiles, and whiskers indicate 5th and 95th percentiles. *P < 0.05, **P < 0.01, ***P < 0.001 by mixed-effects ANOVA with Dunnett’s multiple-comparisons test.

