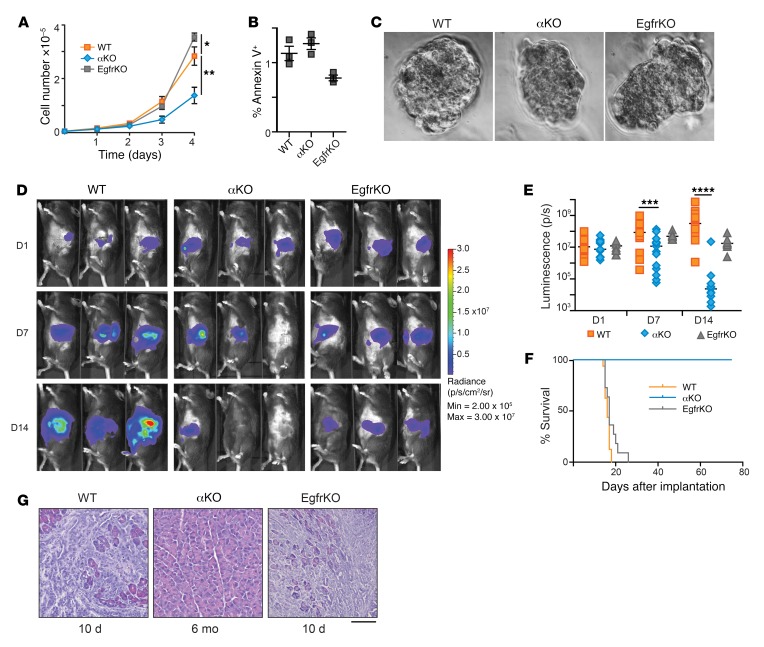
Figure 1. Proliferation of αKO pancreatic cancer cells in vitro and regression in vivo.
(A) Proliferation rates of KPC cell lines in standard 2D culture. Cells plated in triplicate were counted at the times indicated (mean ± SEM; n = 3). *P = 0.0191, WT versus αKO; **P = 0.375, WT versus EgfrKO (1-way ANOVA with Bonferroni’s post hoc test). (B) Percentage of cells positive for annexin V staining at the 4-day time point in A (mean ± SEM, n = 3). P = 0.18, WT versus αKO; P = 0.12, WT versus EgfrKO (1-way ANOVA with Bonferroni’s post hoc test). (C) Representative light microscopy images (×40 magnification) of spheroids formed after 5 days in 3D methylcellulose culture. (D) Cells (0.5 million) were implanted in the head of the pancreas of B6 mice. Tumor growth was monitored by IVIS imaging of the luciferase signal on days 1, 7, and 14 after implantation. Representative images of 3 mice in each group are shown. (E) Quantification of luciferase signals from each mouse. The bars indicate median. On day 7, ***P = 0.0006, WT versus αKO and P > 0.9, WT versus EgfrKO; on day 14, ****P < 0.0001, WT versus αKO and P = 0.0618, WT versus EgfrKO (Kruskal-Wallis test with Dunn’s post hoc test). (F) Kaplan-Meier survival curves for B6 mice implanted with the indicated cell lines. Median survival: WT, 16 days (n = 16); EgfrKO, 17 days (n = 10); all αKO mice were alive at day 80 (n = 17). P < 0.0001, WT versus αKO (log-rank test). (G) H&E-stained sections of pancreatic tissue collected at the indicated times after cell implantation in B6 mice. Scale bar: 100 μm.

