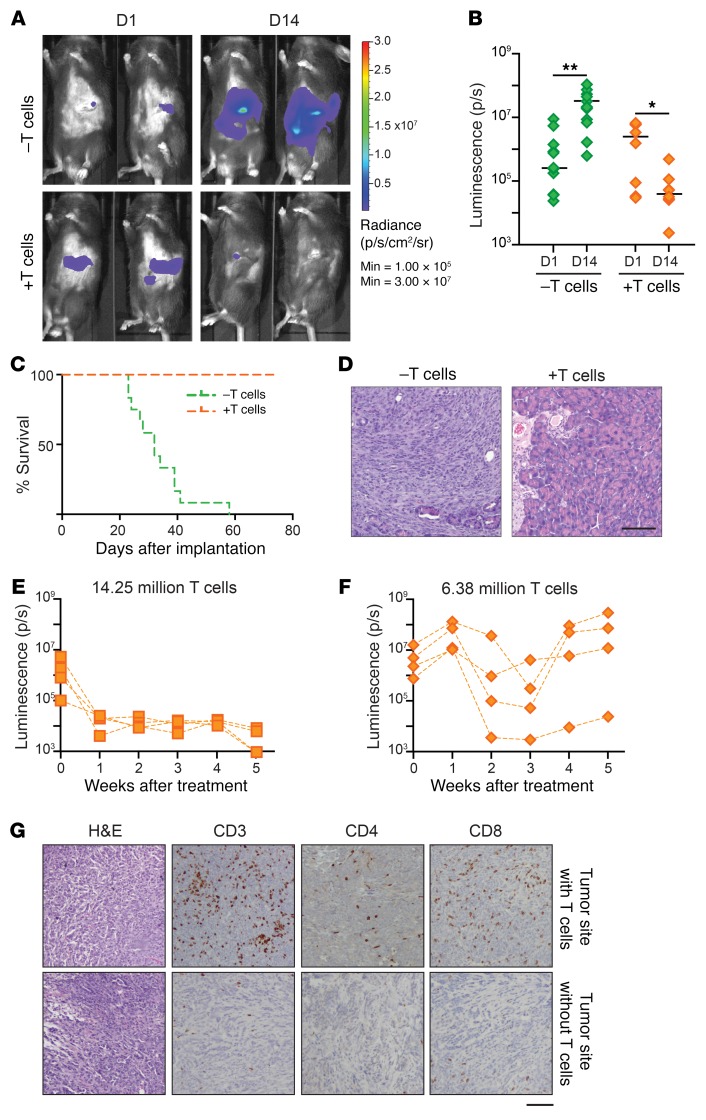
Figure 3. Adoptive T cell transfer protects SCID mice from implanted αKO tumors.
(A–D) SCID mice received either no pretreatment (–T cells, n = 12) (green) or adoptive transfer of 5 million T cells harvested from B6 mice previously implanted with αKO cells (+T cells, n = 8) (orange). One day later, αKO cells (0.5 million) were implanted in the head of the pancreas of each animal. (A) Tumor growth was monitored by IVIS imaging. Representative images of 2 mice in each group are shown. (B) Quantification of luciferase signals from each mouse. Bars indicate median. *P = 0.0156 and **P = 0.0024 (Wilcoxon signed-rank test). (C) Kaplan-Meier survival curves. Median survival: –T cells, 32 days; +T cells, all were alive at day 80. P < 0.00001 (log-rank test). (D) Representative H&E-stained pancreatic sections. Pancreata were collected at the humane endpoint (–T cells) or 4 months after tumor implantation (+T cells). Scale bar: 100 μm. (E–G) 0.5 million αKO KPC cells were implanted in the head of the pancreas of SCID mice (n = 8). Four days later (t = 0), the mice were imaged by IVIS and then treated with 14.25 million or 6.38 million T cells from a convalescent B6 mouse previously implanted with αKO cells (n = 4 per group). Tumor growth was monitored by IVIS imaging. (E and F) Quantification of luciferase signals over time. (G) Mice treated with 6.38 million T cells were sacrificed at week 5 and their pancreata were collected for histology. Representative H&E and IHC images of different tumor sites from the same mouse are shown. Scale bar: 100 μm.

