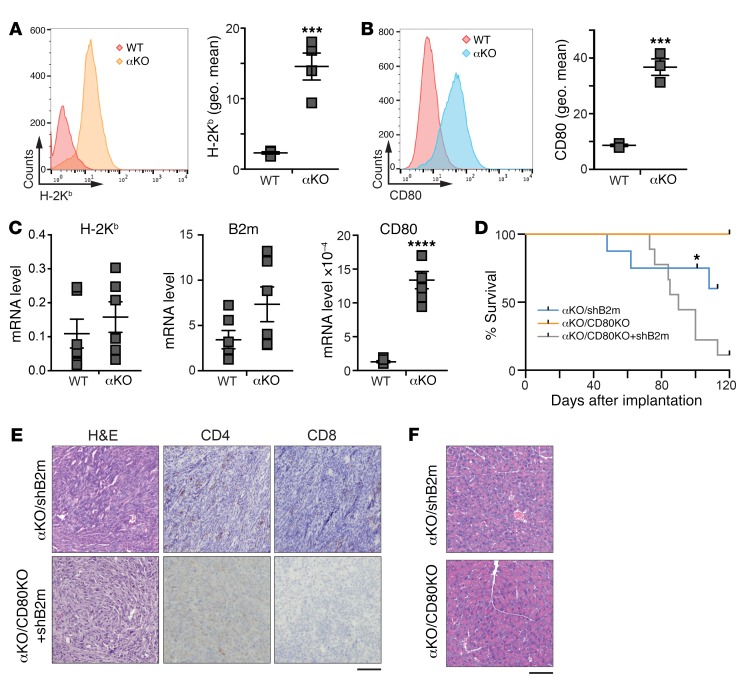
Figure 4. PIK3CA regulates cell surface expression of MHC I and CD80 in KPC cells.
Flow cytometric analysis of cell surface levels of (A) H-2Kb and (B) CD80 in WT and αKO cells. The left panels show representative histograms and the right graphs show the mean ± SEM of the geometric means (geo. mean) of each flow cytometry distribution. H-2Kb, n = 4; CD80, n = 3. ***P = 0.0007 (unpaired t test). (C) qRT-PCR analysis of mRNA expression of H-2Kb, B2m, and CD80 in WT and αKO cells. Gene expression changes were normalized to Hprt. Graph shows mean ± SEM (n = 6). ****P < 0.0001 (unpaired t test). (D–F) B6 mice were implanted with 0.5 million αKO/shB2m, αKO/CD80KO, or αKO/CD80KO+shB2m cells in the head of the pancreas and tumor growth was monitored by IVIS imaging. (D) Kaplan-Meier survival curves for αKO/shB2m, αKO/CD80KO, and αKO/CD80KO+shB2m mice. *A single mouse was euthanized for histology and removed from the study. Median survival: αKO/shB2m, 110.5 days; αKO/CD80KO+shB2m, 87.5 days. All αKO/CD80KO mice were alive at 115 days. P = 0.0026 (log-rank test). (E) Representative H&E and IHC images of pancreatic sections from αKO/shB2m or αKO/CD80KO+shB2m mice that died of tumor progression. Scale bar: 100 μm. (F) Representative H&E-stained pancreatic sections from a single αKO/shB2m mouse or αKO/CD80KO mice euthanized at 101 or 160 days, respectively. Scale bar: 100 μm.

