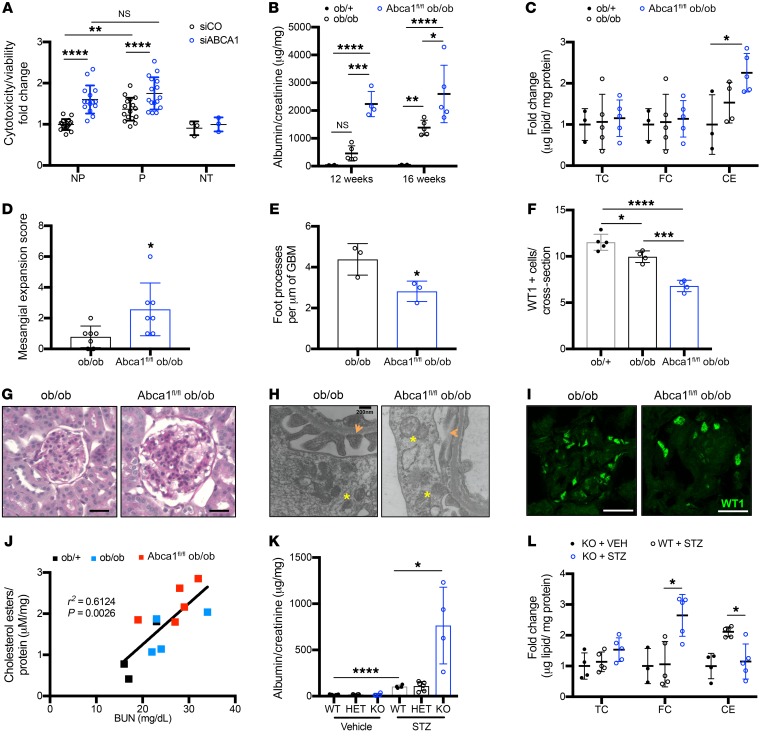
Figure 3. ABCA1 deficiency is a susceptibility factor for podocyte injury contributing to worsened DKD.
(A) Quantification for cytotoxicity normalized to viability for NP (n = 16) and P (n = 15) sera–treated, or untreated (NT, n = 3) siRNA ABCA1 knockdown podocytes (siABCA1) compared with scramble control (siCO) podocytes. (B–F) Ob/+, ob/ob, and Abca1fl/fl ob/ob mice were analyzed for the following: (B) albumin-to-creatinine ratios at 12 and 16 weeks (time of sacrifice) (n = 4–5 per group); (C) TC, FC, and CEs (n = 3–5 per group); (D) mesangial expansion score using PAS-stained kidney cortex sections (n = 7 per group); (E) podocyte foot processes (marked with orange arrows in H) per μm of GBM (n = 3 per group); and (F) podocyte number per glomerular cross section as determined via WT1 antibody. (G–I) Representative images for (G) PAS-stained kidney cortex (scale bars: 25 μm); (H) TEM podocyte foot process measurements (mitochondria marked with yellow asterisks; scale bars: 200 nm); and (I) WT1-stained kidney cortex sections (scale bars: 25 μm). (J) Correlation analysis between BUN and kidney cortex CEs (μM cholesterol/mg protein) (n = 3–5 per group). (K) Quantification of albumin-to-creatinine ratios comparing WT (n = 4–5), Abca1fl/+ (HET) (n = 4–6), and Abcafl/fl (KO) (n = 4) mice injected with vehicle or STZ. (L) Quantification of kidney cortex TC, FC, and CEs content in KO and STZ-treated WT and KO mice (n = 3–5 per group). Two-tailed t test (A, D, E) or 1-way ANOVA followed by Tukey’s multiple comparisons test (B, C, F, K, L) and linear regression used for correlation analyses (J) with r2 and P values shown. *P < 0.05; **P < 0.01; ***P < 0.001; ****P < 0.0001.

