
Figure 1.
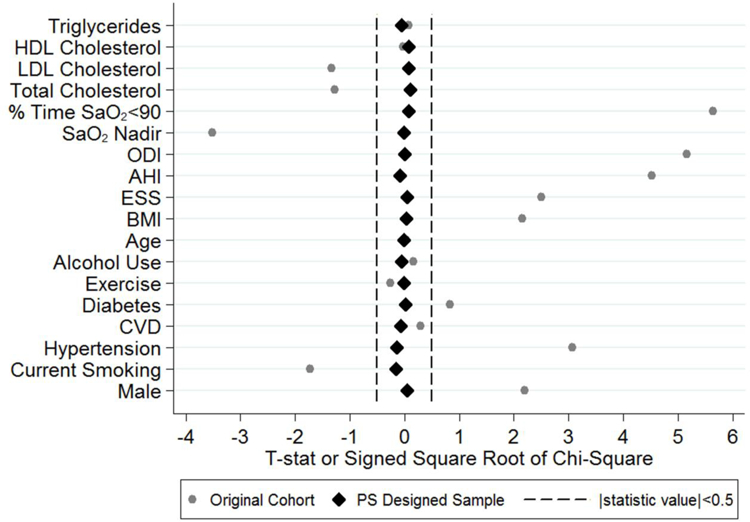
This “Love Plot”[29] illustrates the balance in covariates between PAP adherent patients and non-users in the original cohort and after controlling for propensity score subclass within the designed cohort. The plot shows the T-statistic or signed square root of the chi-square comparing covariates between groups. While a number of covariates were significantly different prior to sub-classification, after controlling for PS subclass in the designed cohort, all statistics are close to zero. HDL: high-density lipoprotein; LDL: low-density lipoprotein; SaO2: oxygen saturation; ODI: oxygen-desaturation index; AHI: apnea-hypopnea index; ESS: Epworth Sleepiness Scale; BMI: body mass index; CVD: cardiovascular disease; PS: propensity score.