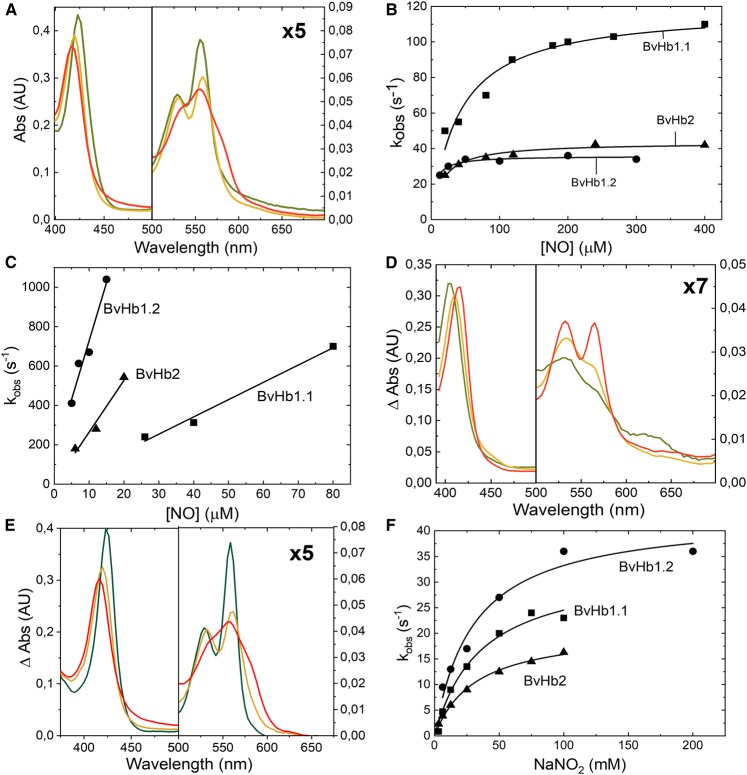
Figure 5. NO and nitrite reaction with BvHbs.
(A) Fitted spectra changes associated with the addition of NO to deoxyferrous BvHb1.2 (from green to red). (B) Pseudo first-order rate constants (kobs) for NO binding for the three proteins are shown as a function of NO concentration. (C) Rate constants for the dioxygenase reaction was found to be linearly dependent on NO concentration for the three BvHbs. (D) Fitted spectra changes associated with the production of ferric Hb-NO adduct (from green to red) after the NOD reaction. (E) Fitted spectra changes associated with deoxyferrous BvHb1.2 following the addition of sodium nitrite. (F) The rate constants for nitrite reduction are plotted as a function of sodium nitrite concentrations resulting into hyperbolas. The kobs values are taken to be the Hisoff rate constant as found with the CO and NO experiments.

