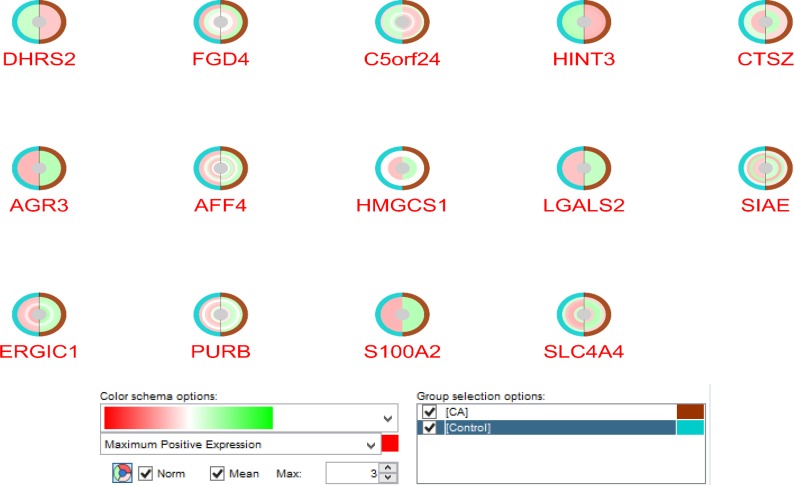
Figure 2.
The normalized and mean expression pattern for the 14 genes in two compared groups via CluePedia software. The control groups are shown by blue color and the coffee extract treated subjects are in brown color. In addition, the color alteration from red to green indicate the expression maximum positive expression changes to negative expression. White circles around genes express null expression values

