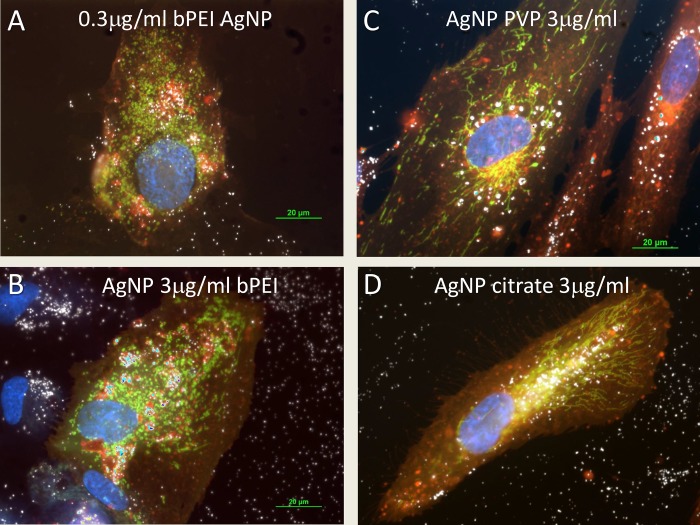
Fig 8. Microscopic comparison between different AgNP.
Microscopic comparison of mitochondria after AgNP uptake into cells treated. with AgNP-bPEI, AgNP-PVP or AgNP-CIT for 24 hours. The AgNP-bPEI showed beaded structures of mitochondria at 0.3μg/ml (Fig 8A) and 3μg/ml (Fig 8B) while the AgNP-PVP 3μg/ml, (Fig 8C) and AgNP-CIT 3μg/ml,(Fig 8D) showed an elongated formation of mitochondria (designated by green color). The NP (designated by white color) are accumulated into the lysosomes (designated by red color) with the AgNP-bPEI samples while the NP are accumulated around the nuclei (Fig 8C) or in the ER (Fig 8D) with the other AgNP coated samples. The cytoplasm was stained with cell mask orange (red) and the nuclei are stained with DAPI (blue). Magnification 600x.

