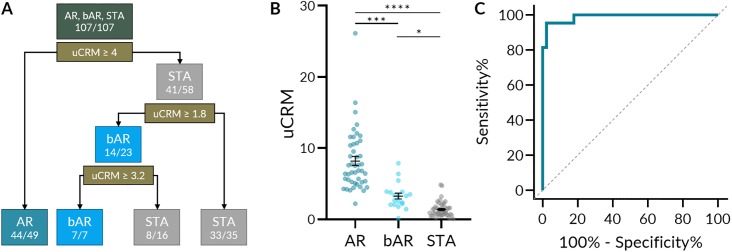
Fig 4. uCRM score classification performance and threshold development by decision tree.
A. A decision tree based on uCRM score classification performance and threshold that could correctly classify AR, bAR, and STA with 96.6% accuracy (85/88). B. Scatter dot plot of the uCRM score for AR, bAR, and STA phenotypes. Significance was determined by nonparametric Kruskal-Wallis test with Dunn’s multiple comparisons correction. C. ROC curve of the uCRM score in discriminating between AR and STA phenotypes (AUC = 0.9886, P < 0.0001). * < 0.05. *** P < 0.001. **** P < 0.0001.

