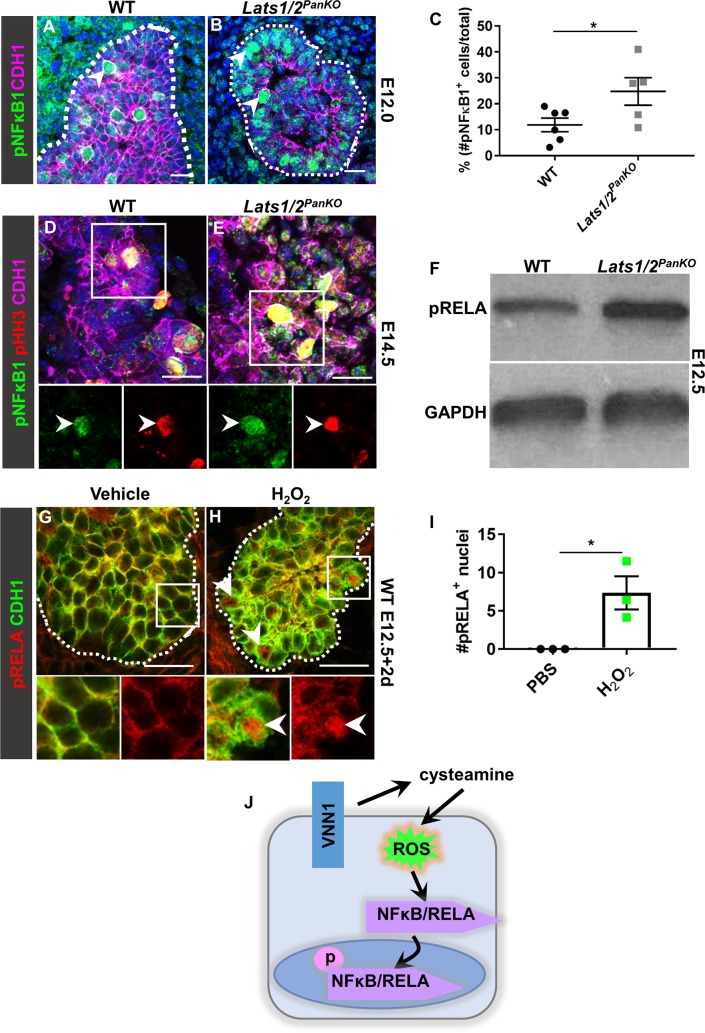
Fig 5. Lats1/2 deletion or ROS stimulates NFκB1 and RELA.
(A, B) Confocal images of pNFκB1 and CDH1 immunostains of WT and Lats1/2PanKO pancreata at E12.0 (n = 3 embryos per genotype). Scale = 20 μm. (C) The average percentage of pNFκB1+ epithelial cells/total epithelial cells per pancreas section at E12.0 was calculated. (D, E) Confocal images of pNFκB1 and pHH3 immunostaining of WT and Lats1/2PanKO pancreata at E14.5 (n = 3 embryos per genotype). Scale = 20 μm. (F) Western blotting from E12.5 WT and Lats1/2PanKO pancreata using pRELA and GAPDH antibodies (n = 3 embryos per genotype). (G, H) Confocal images of CDH1 and pRELA immunostained WT pancreas explants treated with 200 μM H2O2 for 2 hours (n = 4 explants per treatment group). Arrowheads in (H) indicate pRELA+ nuclei. (I) The average number of pRELA+ nuclei per field of view were quantified. Data are shown as mean ± SEM. Statistical significance was determined by Student t test (*p < 0.05). Underlying numerical values can be found in S1 Data. (J) Lats1/2 deficiency increases expression of the pantetheinase VNN1, which produces cysteamine, followed by stimulation of ROS and subsequent NFκB activation. CDH1, E-cadherin; E, embryonic day; NFκB, nuclear factor kappa-light-chain-enhancer of activated B cells; pHH3, phospho-histone H3; pNFκB1, phospho-nuclear factor kappa B subunit 1; pRELA, phospho-RELA proto-oncogene, NF-KB subunit; ROS, reactive oxygen species; VNN1, vanin1; WT, wild type.

