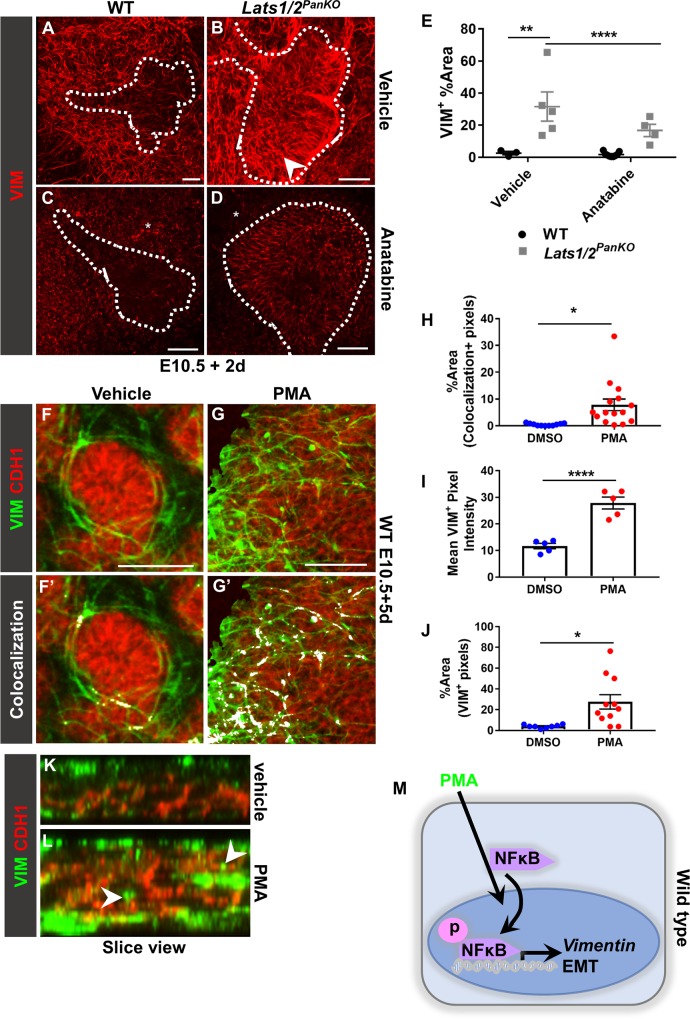
Fig 6. NFκB is necessary and sufficient to initiate pancreatic EMT.
(A–D) Compressed Z stack images of VIM+ immunostains of vehicle- or anatabine-treated WT and Lats1/2PanKO pancreas explants (n = 3–6 explants per genotype per treatment group). Scale = 50 μm. (B) Arrowhead indicates ectopic VIM expression in Lats1/2PanKO epithelium. (C, D) Anatabine also decreased mesenchymal VIM expression (asterisks). (E) The percent area covered by VIM+ pixels within the pancreatic epithelium (above a set threshold) was quantified in anatabine- and vehicle-treated Lats1/2PanKO and WT explants. Data are shown as mean ± SEM. Statistical significance was determined by Student t test (*p < 0.05; **p < 0.01; ***p < 0.001; ****p < 0.0001). (F, G) Compressed Z stack confocal images of CDH1 and VIM immunostains of WT pancreas explants treated with 10 μg/mL PMA (n = 3 explants per treatment). Masked VIM (VIM within CDH1+ progenitor surface volume) was used to exclude mesenchymal VIM. Scale = 50 μm. (F’,G’) Colocalization (white) was calculated above common thresholds and visualized using Imaris. (H) The percent area of VIM+CDH1 colocalization pixels was quantified using ImageJ. (I, J) Mean VIM+ pixel intensity and the percent area of VIM+ pixels (above a common threshold) within WT pancreatic epithelium were quantified using ImageJ. Underlying numerical values can be found in S1 Data. (K, L) Slice view through Z stack shows VIM (green) + CDH1 (red). (L) Arrowheads indicate VIM within the CDH1+ epithelial layer. (M) PMA hyperactivates NFκB, which initiates EMT in pancreatic progenitors. CDH1, E-cadherin; EMT, epithelial-mesenchymal transition; NFκB, nuclear factor kappa light chain enhancer of activated B cells; PMA, Phorbol 12-myristate 13-acetate; VIM, vimentin; WT, wild type.

