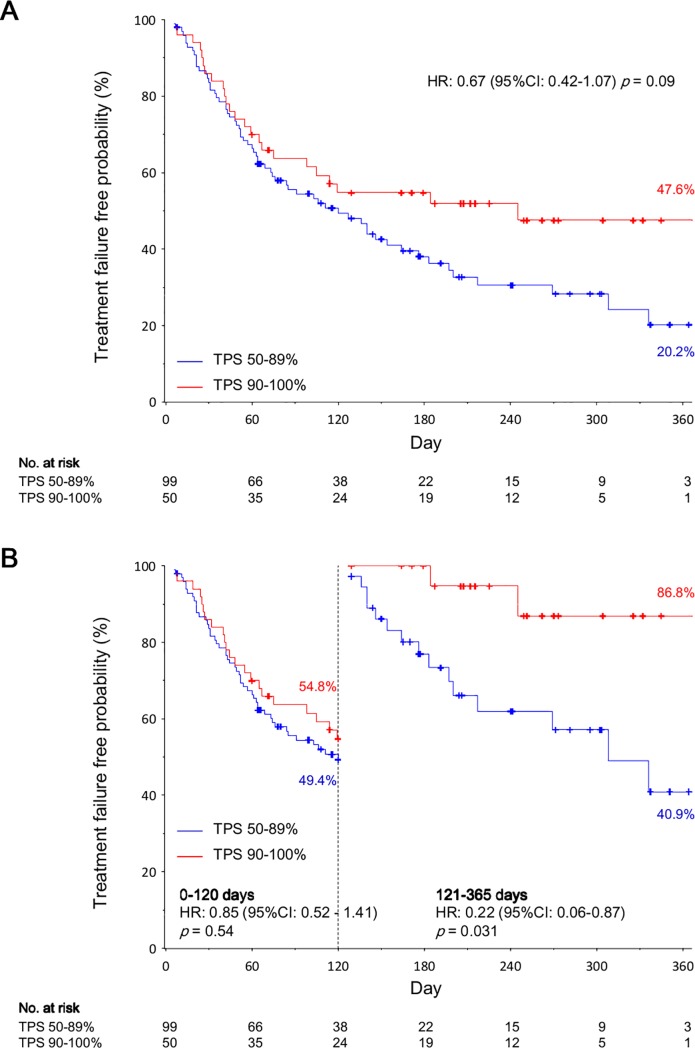
Fig 1. Time to treatment failure of pembrolizumab: the tumor proportion score 90–100% cohort versus the tumor proportion score 50–89% cohort.
Panel A shows the Kaplan–Meier survival curves for the time to treatment failure according to the programed death ligand-1 expression levels for the tumor proportion score 90–100% cohort versus the tumor proportion score 50–89% cohort. Panel B shows the Kaplan–Meier survival curves for time to treatment failure before and after 120 days according to the programed death ligand-1 expression levels in landmark analyses. Hazard ratios are for the tumor proportion score 90–100% cohort versus the tumor proportion score 50–89% cohort. The hazard ratios, 95% confidence intervals, and p-values were calculated using univariate Cox regression analysis. Cross marks represent data censored at the last time the patient was known to be alive. Abbreviations: HR, hazard ratio; TPS, tumor proportion score.

