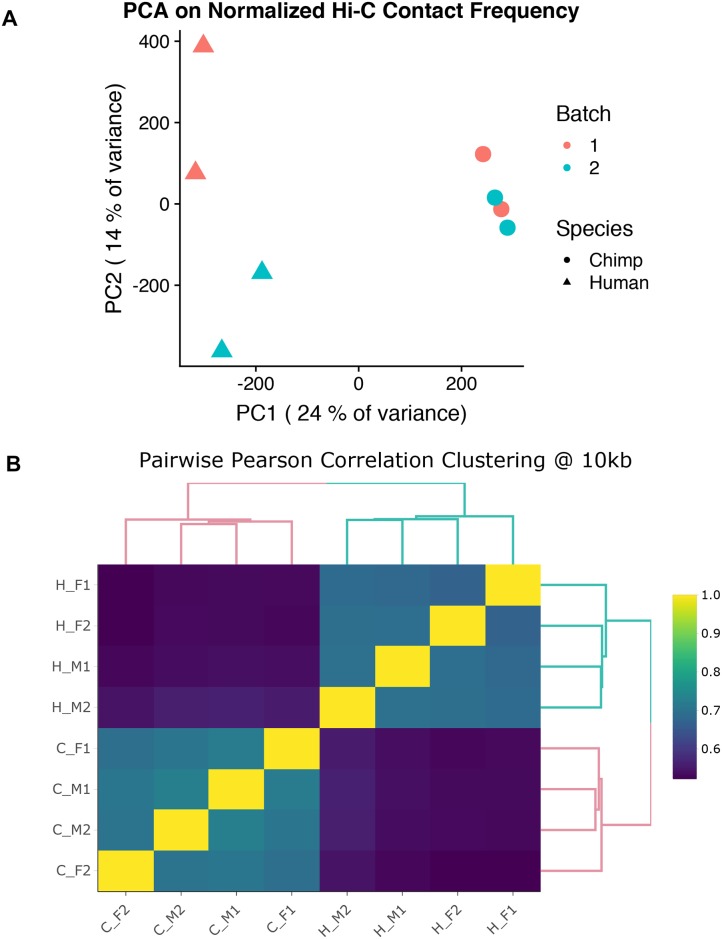
Fig 1. General patterns in Hi-C data.
(A) Principal components analysis (PCA) of HOMER-normalized interaction frequencies for the union of all contacts in humans (triangles) and chimpanzees (circles). PC1 is highly correlated with species (r = 0.98; P < 10–5). (B) Unsupervised hierarchical clustering of the pairwise correlations (Pearson’s r2) of HOMER-normalized interaction frequencies at 10 kb resolution. The first letter in the labels demarcates the species (H for human and C for chimpanzee), and the following symbols indicate sex (male, M or female, F) and batch (1 or 2).

