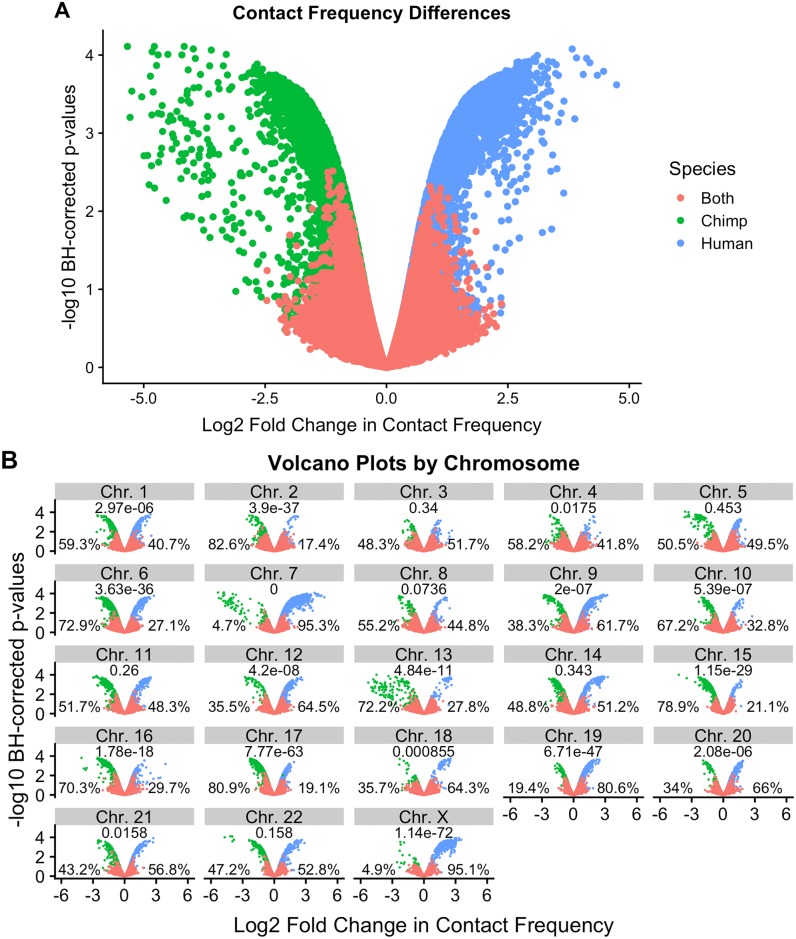
Fig 2. Linear modeling reveals large-scale chromosomal differences in contact frequency.
(A) Volcano plot of log2 fold change in contact frequency between humans and chimpanzees (x-axis) against Benjamini-Hochberg FDR (y-axis), after filtering non-orthologus regions (results for unfiltered data are plotted in S9 Fig). Data are colored by the species in which the contact was originally identified as significant. (B) Per-chromosome volcano plot using the same legend as in A. P-values provided for a binomial test of the null that inter-species differences in contact frequencies are evenly distributed. The percentage of contacts with significant higher frequency in each species is noted.

