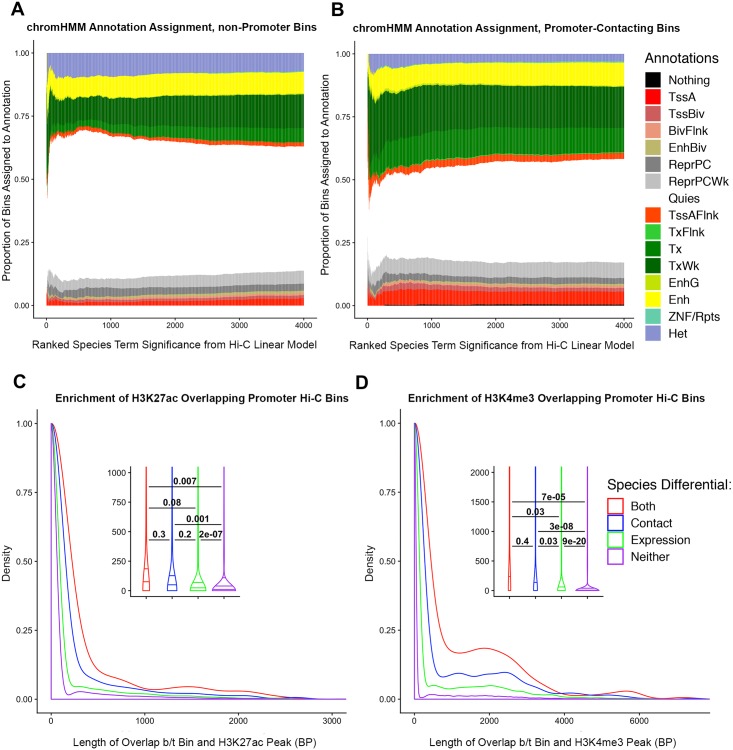
Fig 7. Overlap of epigenetic signatures and Hi-C contacts.
(A) Hi-C loci that do not make contact with promoters are ranked in order of decreasing DC FDR (x-axis). The y-axis shows cumulative proportion of chromHMM annotation assignments for all Hi-C loci at the given FDR or lower. (TssA-Active TSS, TSSBiv-Bivalent/Poised TSS, BivFlnk-Flanking Bivalent TSS/Enh, EnhBiv-Bivalent Enhancer, ReprPC-Repressed PolyComb, ReprPCWk-Weak Repressed PolyComb, Quies-Quiescent/Low, TssAFlnk-Flanking Active TSS, TxFlnk-Transcription at gene 5’ and 3’, Tx-Strong transcription, TxWk-Weak transcription, EnhG-Genic Enhancers, Enh-Enhancers, ZNF/Rpts-ZNF genes and repeats, Het-Heterochromatin). (B) Same as A, but only considering Hi-C loci making contact with promoter bins. Results of separating promoter-contacting bins between DE and non-DE genes can be seen in S19 Fig. (C) Density plot of the base pair overlap between different classes of Hi-C contact loci and H3K27ac. Histone mark data were obtained from ENCODE in experiments carried out in human iPSCs. We grouped contacts into 4 classes, indicated by color: those that show differential contact between species, those that show differential expression between species, those that show both, and those that show neither. We used pairwise t-tests to compare differences in the mean overlap among the four classes of Hi-C loci. (D) Same as C, but performed on H3K4me3 data obtained from ENCODE, collected in hESCs. Results with other histone marks can be seen in S18 Fig.

