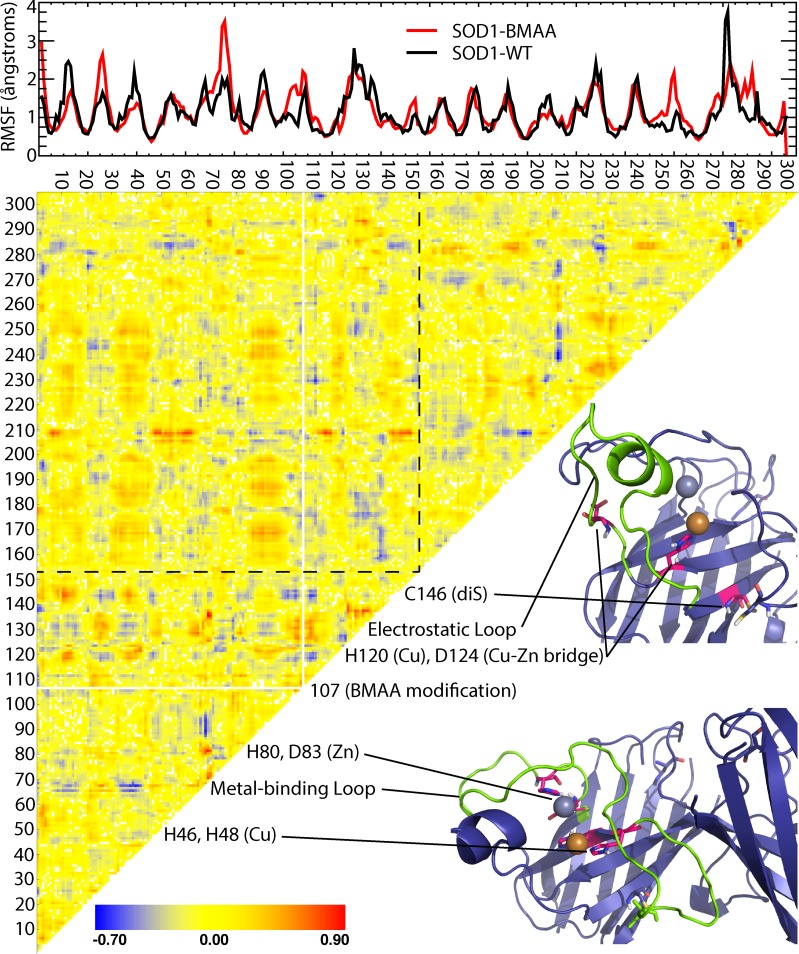
Fig 2. BMAA-SOD1 features altered dynamics near disulfide bond and metal ion binding sites.
Heat map of changes in correlated motions between residues (standard sequence numbering provided) upon modification with BMAA. Red indicates increased correlated motions, blue indicates decreased correlated motions, and yellow indicates no change. Dotted line indicates the divide between the two monomer chains. Select significantly affected structural features critical for SOD1 stability are labeled, with location on the SOD1 structure highlighted. A comparison of root mean square fluctuations (RMSF) at each residue for SOD1 with and without BMAA modification is included (top), highlighting regions of increased or decreased flexibility due to misincorporation of BMAA.

