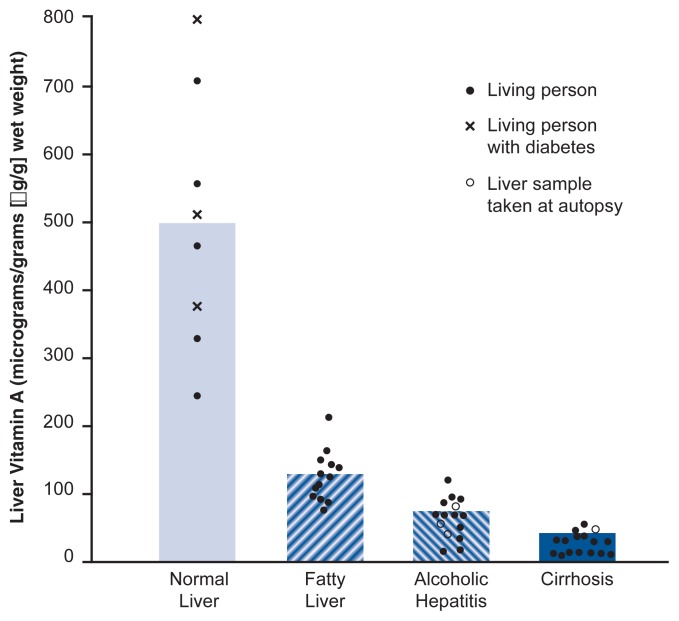
Figure 2.
Vitamin A levels in the livers of healthy people and patients with various stages of alcoholic liver disease. The values were obtained by taking liver biopsies from study participants. Each circle or x represents one person; a filled circle represents a living participant, an open circle represents a sample taken during an autopsy of a deceased participant, and each x represents a study participant with a normal liver who had diabetes. The bars represent the mean value of all participants in each group. P values for the differences between the groups were all significant at the 0.001 level.
SOURCE: Leo and Lieber 1982.

